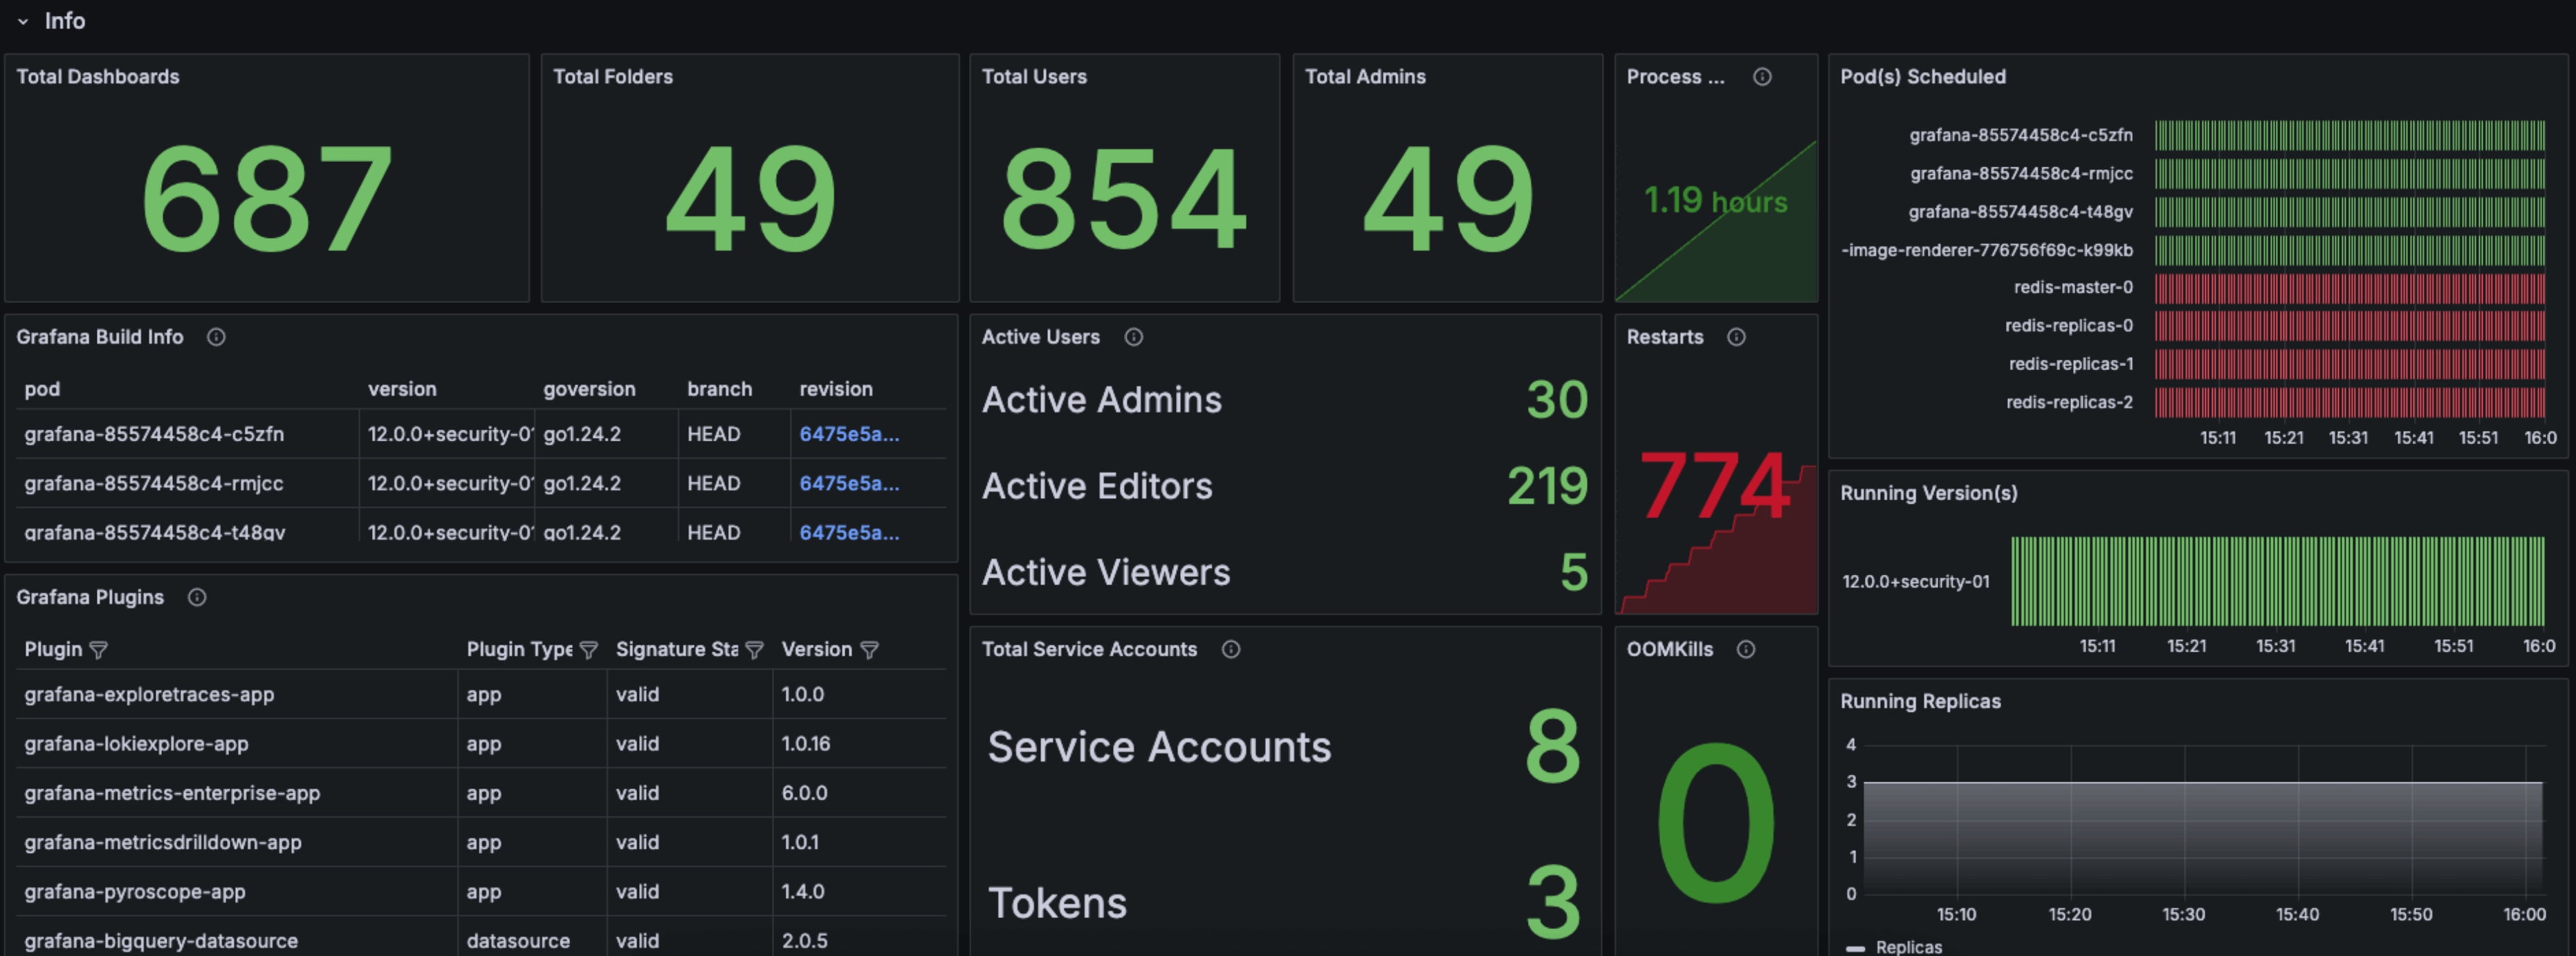
Grafana Internal Metrics
Provides insights into Grafana itself via internal metrics
See https://grafana.com/docs/grafana/latest/setup-grafana/set-up-grafana-monitoring/ for details on how to collect internal metrics as a prereq
Written for kubernetes deployments, but with some tweaking of variables should also work for deployment on individual server instances
Data source config
Collector type:
Collector plugins:
Collector config:
Revisions
Upload an updated version of an exported dashboard.json file from Grafana
| Revision | Description | Created | |
|---|---|---|---|
| Download |