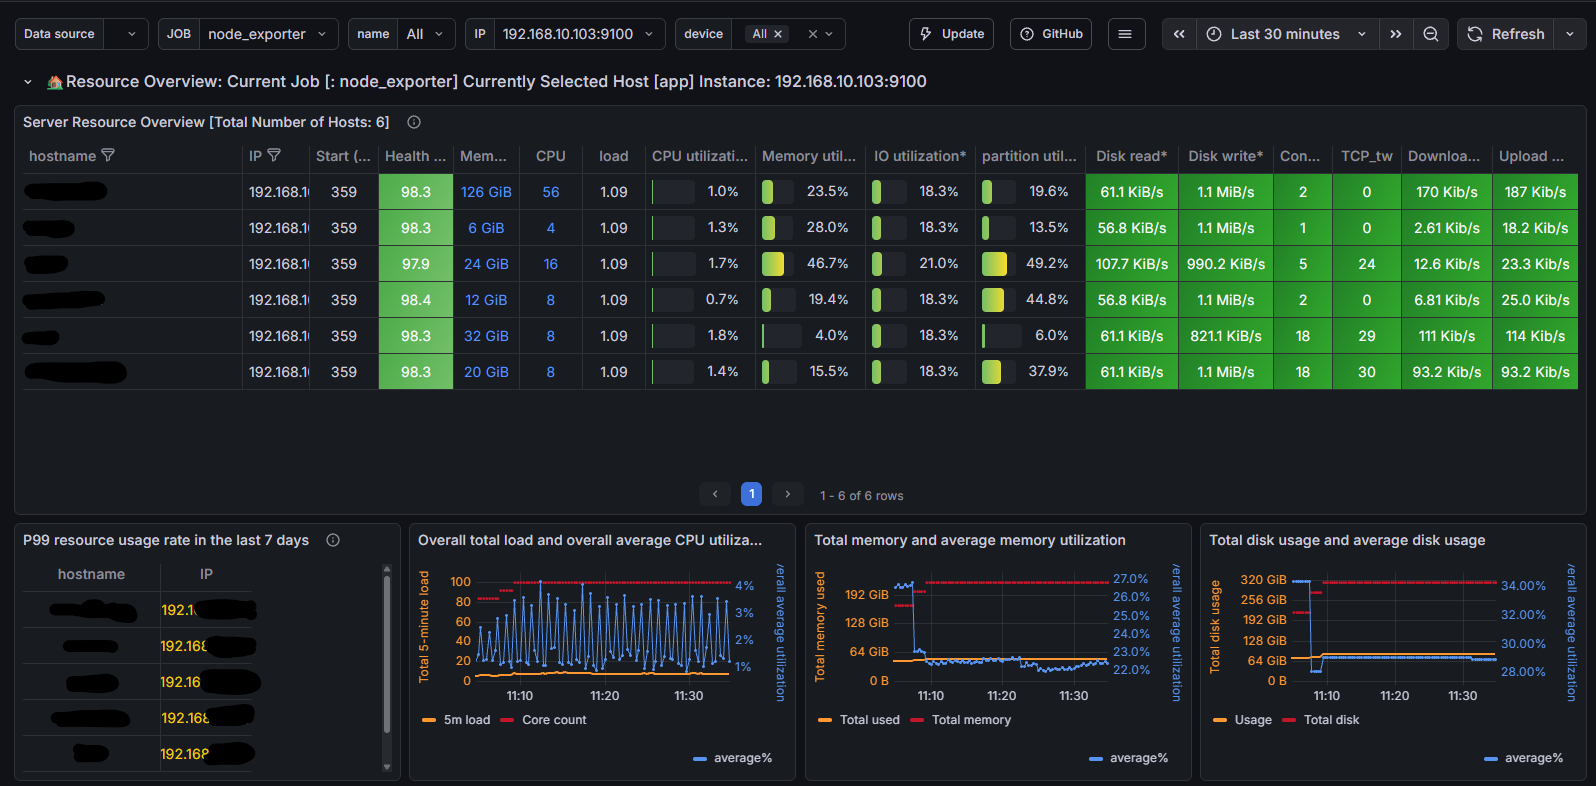
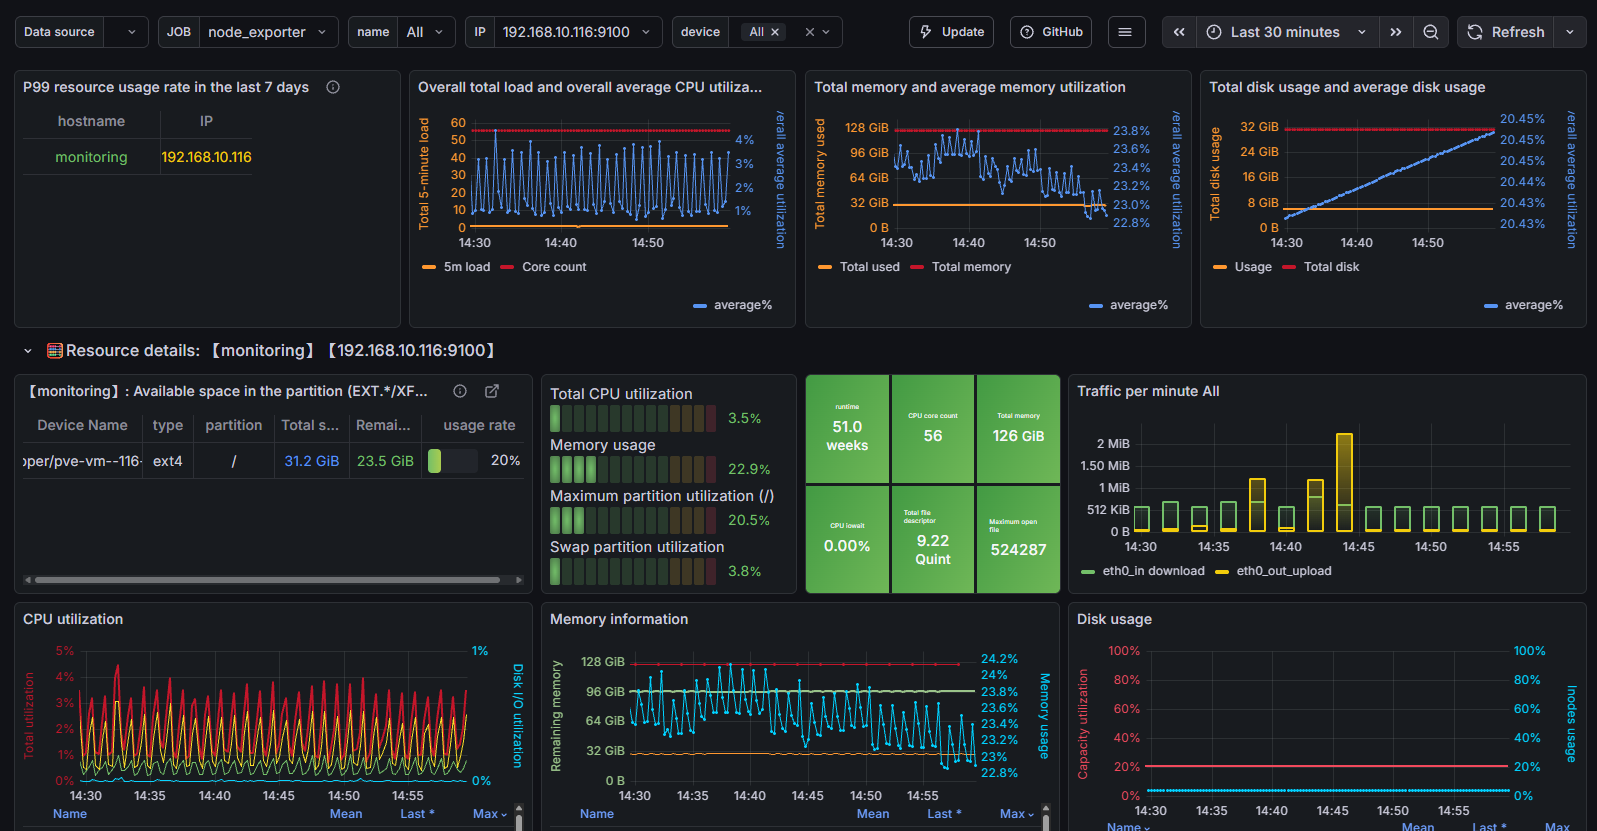
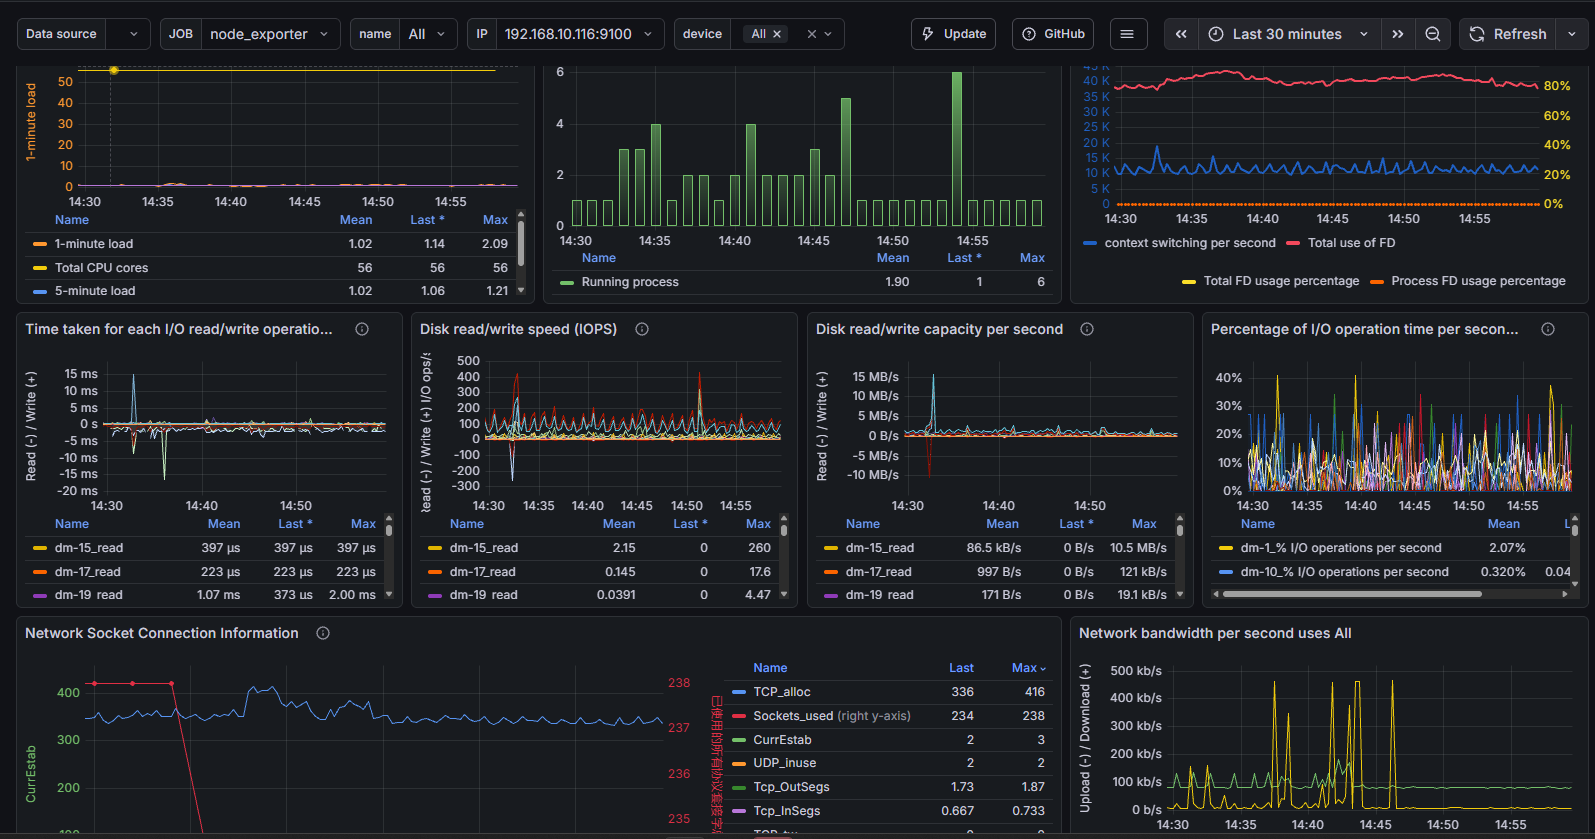
Node Exporter Dashboard
Updated 2024.05.22, optimized the display of important metrics. Rebuilt using the new Grafana 10 style, added the concept of health score, and added some charts for overall resource consumption information. Includes overall resource display and detailed resource charts: monitoring metrics such as CPU, memory, disk IO, and network. https://github.com/starsliao/TenSunS
🎉 Node Exporter Dashboard with Auto‑Sync — Updated Version! This project is an enhanced, fully translated, and auto‑synchronized version of the Node Exporter Dashboard. If you’d like to contribute — whether by improving the translation, refining panels, optimizing queries, or suggesting new features — your help is very welcome!
👉 Project repository: https://github.com/Bobur/node_exporter_dashboard
🤝 Want to contribute? All contributions are appreciated — feel free to open Issues or submit Pull Requests. Let’s make this dashboard even better together!
Data source config
Collector config:
Upload an updated version of an exported dashboard.json file from Grafana
| Revision | Description | Created | |
|---|---|---|---|
| Download |
Linux Server
Monitor Linux with Grafana. Easily monitor your Linux deployment with Grafana Cloud's out-of-the-box monitoring solution.
Learn more