EKS Node Monitoring Agent Observability
Comprehensive health monitoring for EKS nodes powered by the EKS Node Monitoring Agent and kubernetes-event-exporter. This dashboard tracks critical hardware, kernel, and network conditions that trigger Karpenter Node Auto-Repair (Disruption) to maintain cluster reliability and automate infrastructure recovery.
EKS Node Monitoring Agent Observability
This dashboard provides comprehensive visibility into EKS Node health, specifically designed to monitor the EKS Node Monitoring Agent add-on. It correlates low-level system signals with Karpenter's Node Auto-Repair logic to provide a complete picture of cluster reliability.
Key Features
- AWS Health Integration: Fully mapped to the AWS EKS Node Health documentation.
- Auto-Repair Synergy: Tracks events that trigger Karpenter Node Auto-Repair.
- 5-Pillar Monitoring: Categorized views for Accelerated Hardware (GPU/Neuron), Networking, Storage, Kernel, and Container Runtime.
- Noise-Reduced Alerts: Optimized LogQL queries to distinguish between transient Events and critical Conditions.
Prerequisites
To use this dashboard, ensure your cluster has the following components installed:
- EKS Node Monitoring Agent: The core add-on providing node-level signals.
- kubernetes-event-exporter: Required to scrape K8s events and push them to Loki/Prometheus.
- Grafana Loki: Used as the primary data source for event logs.
- Prometheus: (Optional) For correlating system metrics with health events.
- Karpenter: To visualize automated disruption and repair actions.
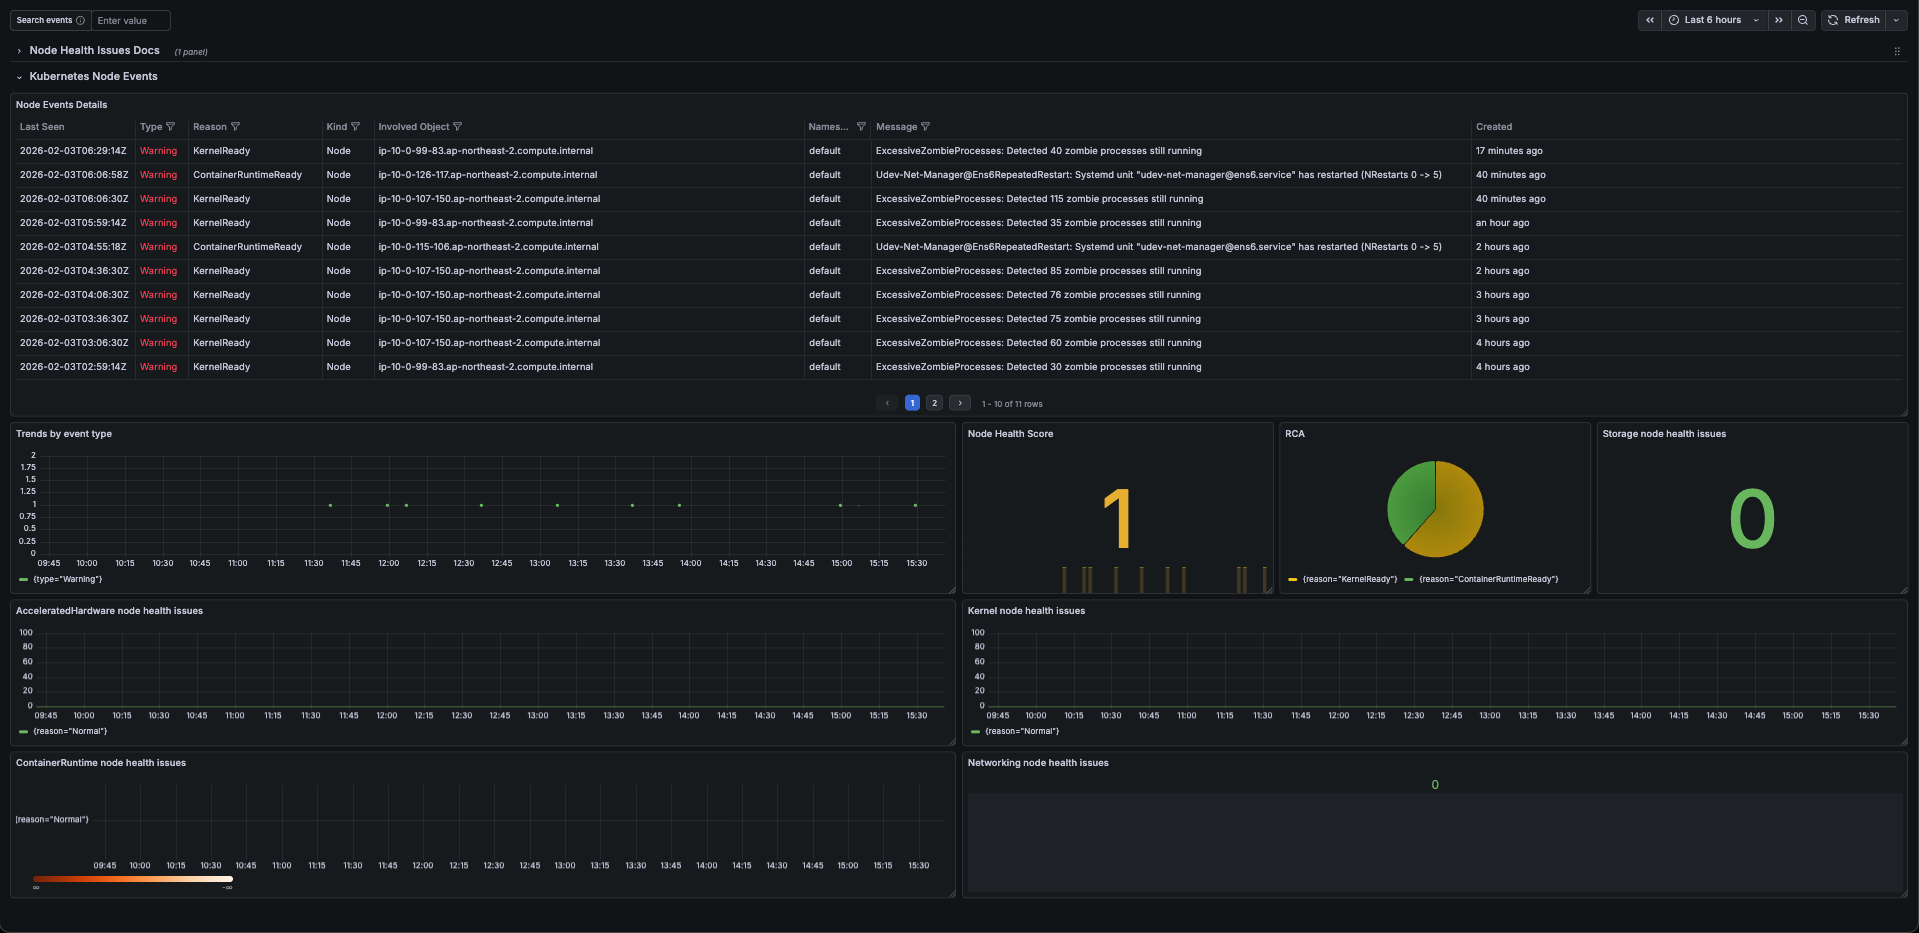
Dashboard Sections
- Summary (Global Health): High-level "Healthy Node Ratio" and active critical conditions.
- Accelerated Hardware: Monitoring NVIDIA/Neuron XID and HBM errors.
- Networking & CNI: Tracks Bandwidth, PPS, and IPAMD address exhaustion.
- Storage & I/O: Visualizes EBS throughput limits and disk latency.
- Kernel & OS Stability: Detects Soft Lockups, OOMs, and PID/File exhaustion.
- Runtime & Kubelet: Tracks CRI failures and Pod/Service restart loops.
Setup Instructions
- Import this dashboard via JSON or ID.
- Select your Loki data source.
- Ensure your
kubernetes-event-exporteris configured to include the fieldreportingComponent: eks-node-monitoring-agent. - (Recommended) Set the "No Value" option in Stat panels to
0orHealthyto maintain a clean UI when no errors are present.
Data source config
Collector config:
Upload an updated version of an exported dashboard.json file from Grafana
| Revision | Description | Created | |
|---|---|---|---|
| Download |
Grafana Agent
Easily monitor metrics and logs from a Grafana Agent instance with Grafana Cloud's out-of-the-box monitoring solution.
Learn more