Nginx Insights Dashboard: Vector + VictoriaLogs (LogsQL)
A high-performance Nginx insights dashboard designed for modern observability stacks using Vector (collector) and VictoriaLogs (storage). Leveraging the power of LogsQL, this dashboard runs real-time aggregations on massive log volumes with sub-second latency.
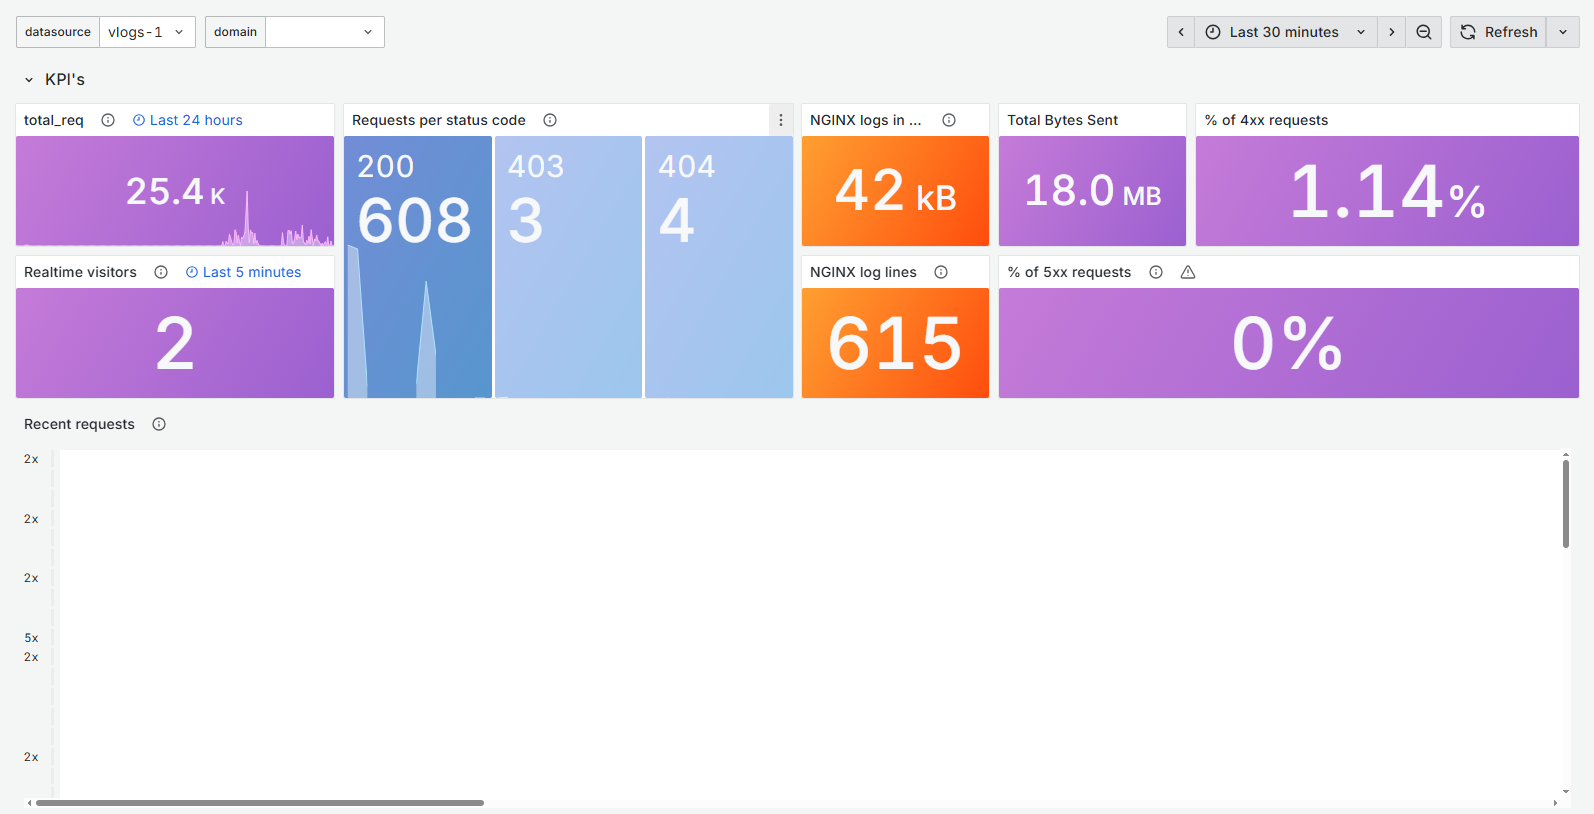
The Nginx Insights Dashboard: Vector + VictoriaLogs (LogsQL) dashboard uses the __expr__ and victoriametrics-logs-datasource data sources to create a Grafana dashboard with the logs, stat, table and timeseries panels.
Data source config
Collector type:
Collector plugins:
Collector config:
Revisions
Upload an updated version of an exported dashboard.json file from Grafana
| Revision | Description | Created | |
|---|---|---|---|
| Download |
NGINX
Easily monitor NGINX, an open source software for web serving, reverse proxying, caching, load balancing, media streaming, and more, with Grafana Cloud's out-of-the-box monitoring solution.
Learn more