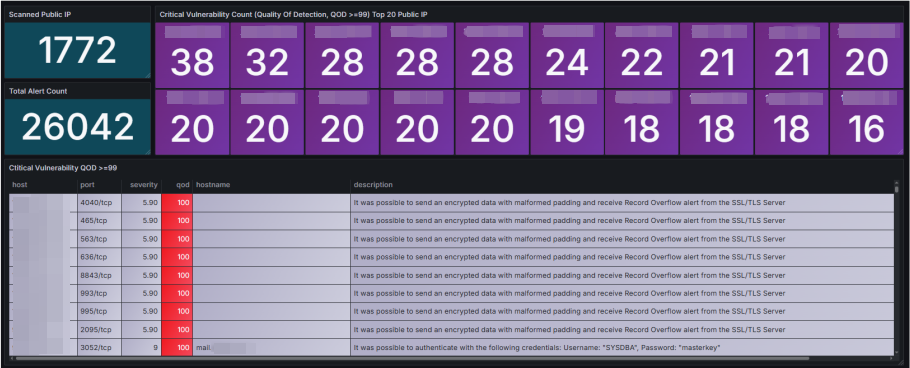
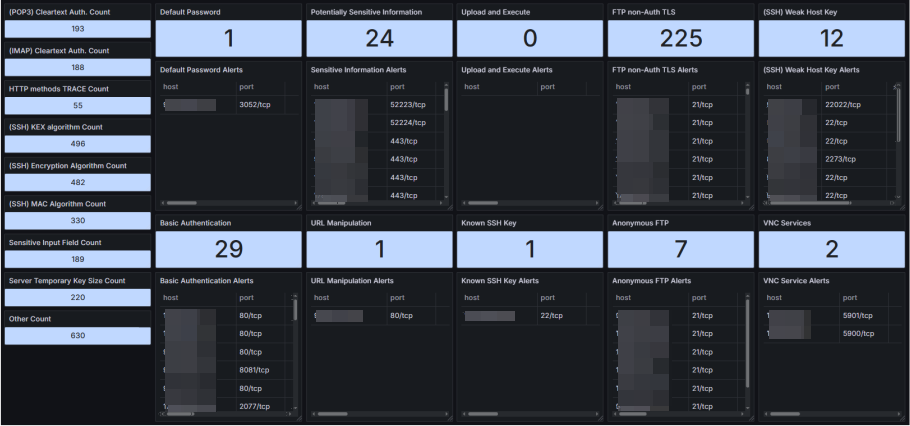
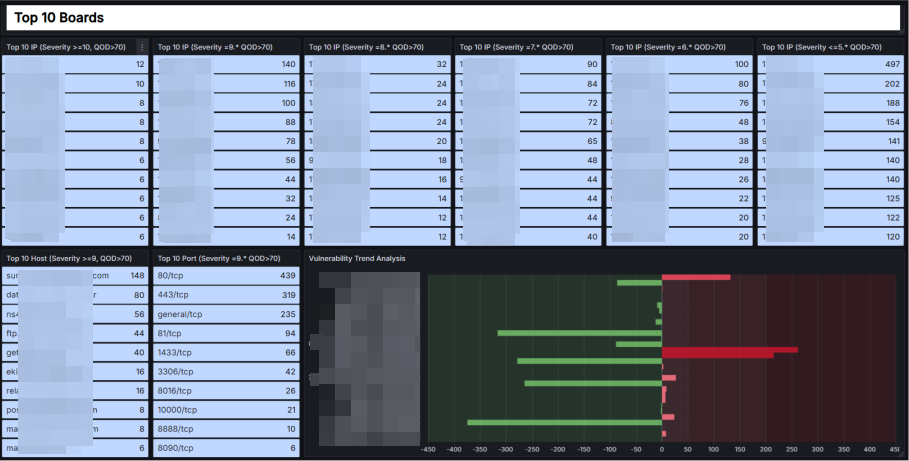
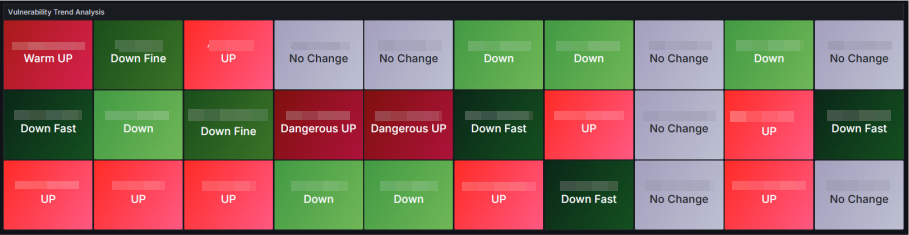
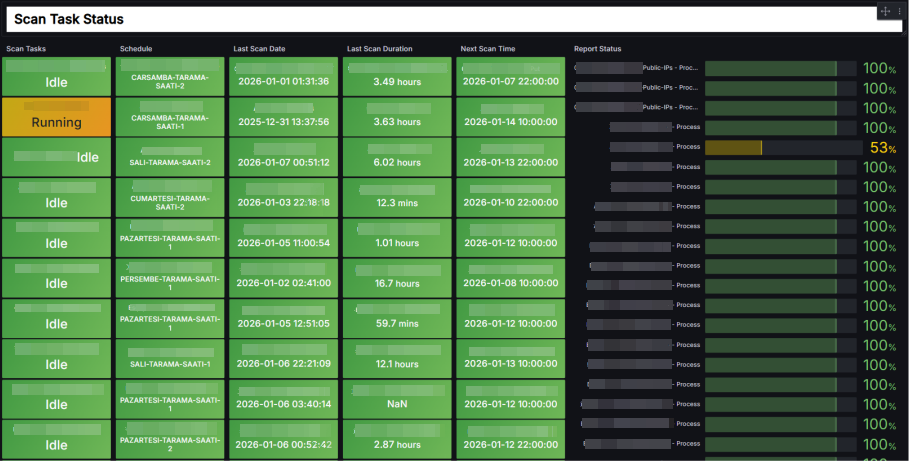
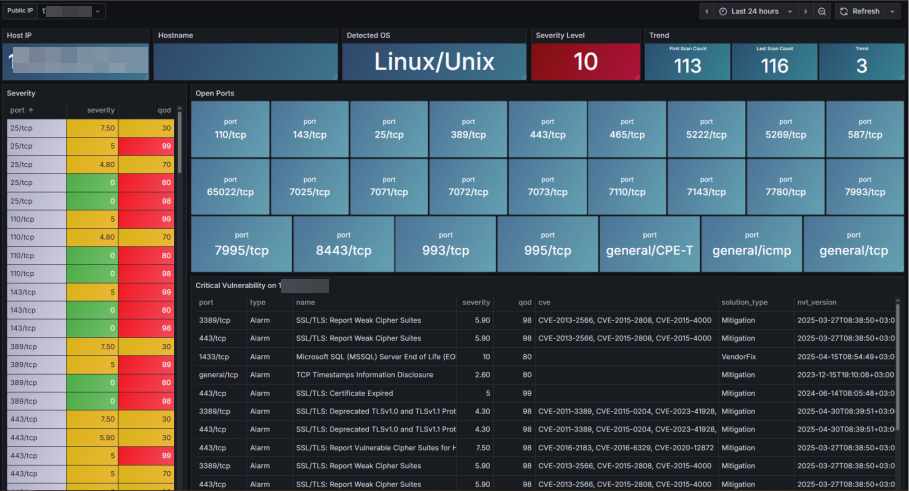
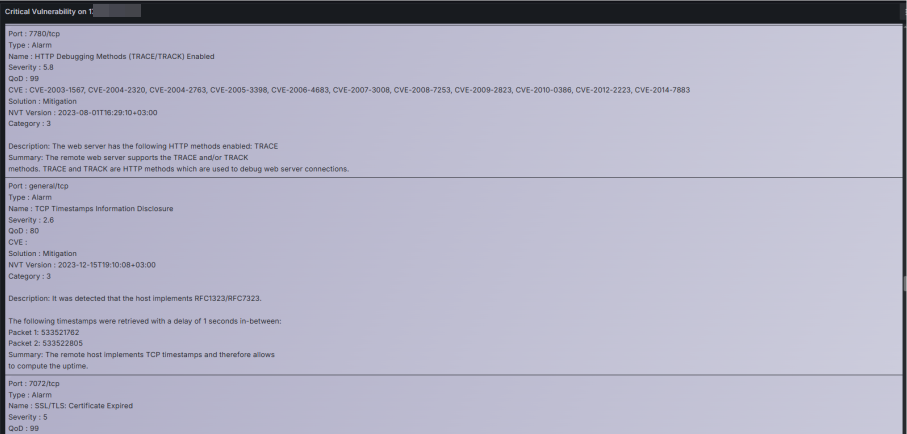
OpenVAS Vulnerability Dashboard
This dashboard shows you; detailed, real-time vulnerability scans performed with OpenVAS.
OTIG Stack - (OpenVAS, Telegraf, InfluxDB, Grafana)
We will deploy the entire architecture on Docker using Compose, within the same container network. Our goal is secure connect to OpenVAS database 'PostgreSQL' with Grafana. This setup will operate in a closed loop. Grafana, OpenVAS, and InfluxDB will only be accessible on Nginx using HTTPS.
PS: The latest dashboard JSON files are on GitHub because we couldn't upload them here.
GitHub: https://github.com/oguzhantanir/openvas_vulnerability_dashboard
First step
Create a wildcard selfsign or authority certificate. We are continuing with selfsign.
cat > wildcard-test.com.cnf <<'EOF'
[ req ]
default_bits       = 4096
prompt             = no
default_md         = sha256
req_extensions     = req_ext
distinguished_name = dn
[ dn ]
C  = TR
ST = Lab
L  = Test
O  = TestOrg
OU = IT
CN = *.test.com
[ req_ext ]
subjectAltName = @alt_names
[ alt_names ]
DNS.1 = *.test.com
DNS.2 = test.com
EOF
Create selfsign certificate on "certs" folder.
openssl req -x509 -nodes -days 825 -newkey rsa:4096 -keyout wildcard.test.com.key -out wildcard.test.com.crt -config wildcard-test.com.cnf
Second step
Deploy with docker compose file.
docker compose -f docker-compose.yml up -d
docker ps -a
Now, create DNS 'A record' or write to the localhost file using the server's local IP address.
10.10.0.20  openvas.test.com
10.10.0.20  grafana.test.com
10.10.0.20  influxdb.test.com
Then
Call this URL using your browser.
OpenVAS default login user:admin password:admin
Change this password.
Last step
Create a user in the OpenVAS PostgreSQL database for Grafana.
docker exec -it otig_stack-gvmd-1 bash
su -s /bin/bash gvmd
psql -U postgres -d gvmd
CREATE USER grafana WITH PASSWORD 'Aa123456';
GRANT CONNECT ON DATABASE gvmd TO grafana;
GRANT USAGE ON SCHEMA public TO grafana;
GRANT SELECT ON ALL TABLES IN SCHEMA public TO grafana;
GRANT SELECT ON ALL SEQUENCES IN SCHEMA public TO grafana;
ALTER DEFAULT PRIVILEGES IN SCHEMA public
GRANT SELECT ON TABLES TO grafana;
\q
Connect to Postgresql database on Grafana.
Import dashboard 'json' files to Grafana.
Finally
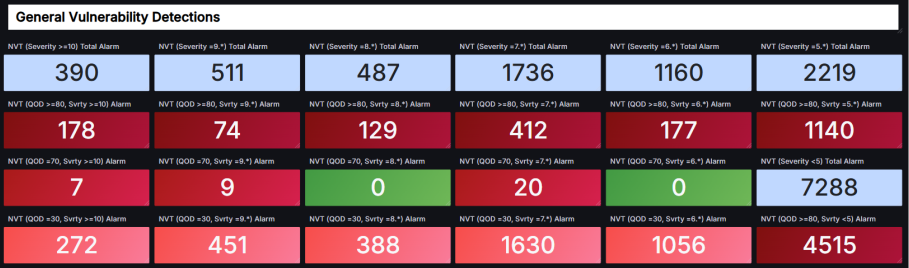
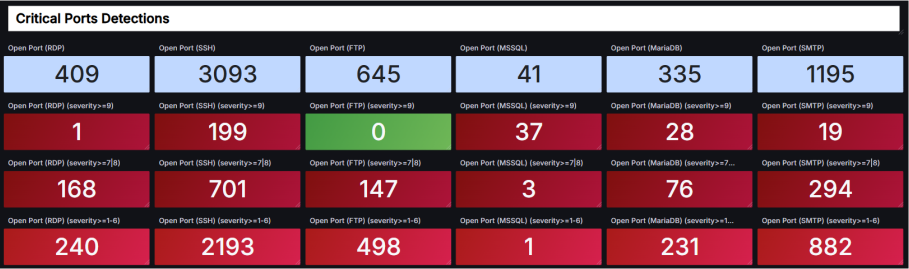
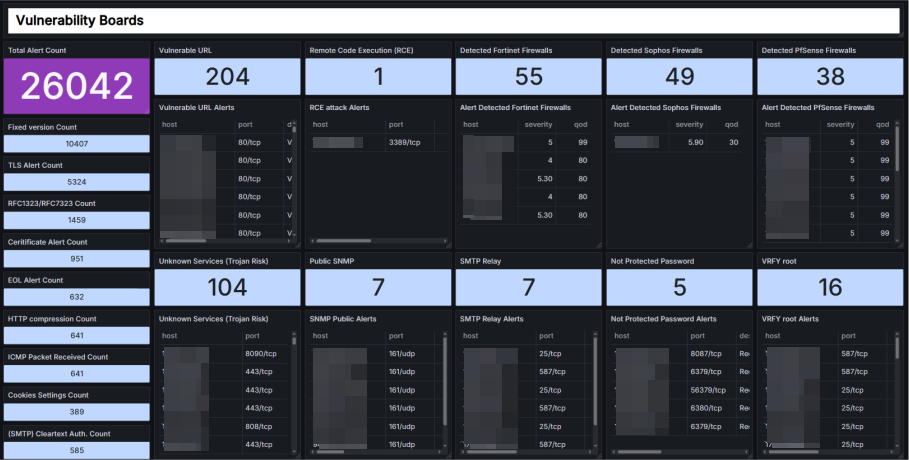
Configure your vulnerability scans in OpenVAS. You will begin to see the findings vulnerability on the Grafana dashboard. This dashboard is customizable and flexible. You can also generate alert triggers and action plans.
Data source config
Collector config:
Upload an updated version of an exported dashboard.json file from Grafana
| Revision | Description | Created | |
|---|---|---|---|
| Download |