PCS Cloudwatch Logs
An AWS CloudWatch logs dashboard, for fetching CloudWatch logs by log groups with the possibility of searching by any terms to filter the log results (the log result contains all the metadata needed to debug: requestId, timestamp, logStream, ...). The dashboard contains the following: - Log results panel - Log results distribution panel - Total results panel - Incoming log events distribution panel - Total incoming log events panel
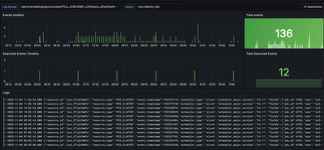
The PCS Cloudwatch Logs dashboard uses the cloudwatch data source to create a Grafana dashboard with the logs, stat and timeseries panels.
Data source config
Collector type:
Collector plugins:
Collector config:
Revisions
Upload an updated version of an exported dashboard.json file from Grafana
| Revision | Description | Created | |
|---|---|---|---|
| Download |
Grafana Loki (self-hosted)
Easily monitor Grafana Loki (self-hosted), a horizontally scalable, highly available, multi-tenant log aggregation system inspired by Prometheus, with Grafana Cloud's out-of-the-box monitoring solution.
Learn more