Restate: Internals
Deep dive into Restate Server components for troubleshooting and performance analysis
Official deep-dive monitoring dashboard for Restate - the platform for building resilient applications with durable execution.
Overview
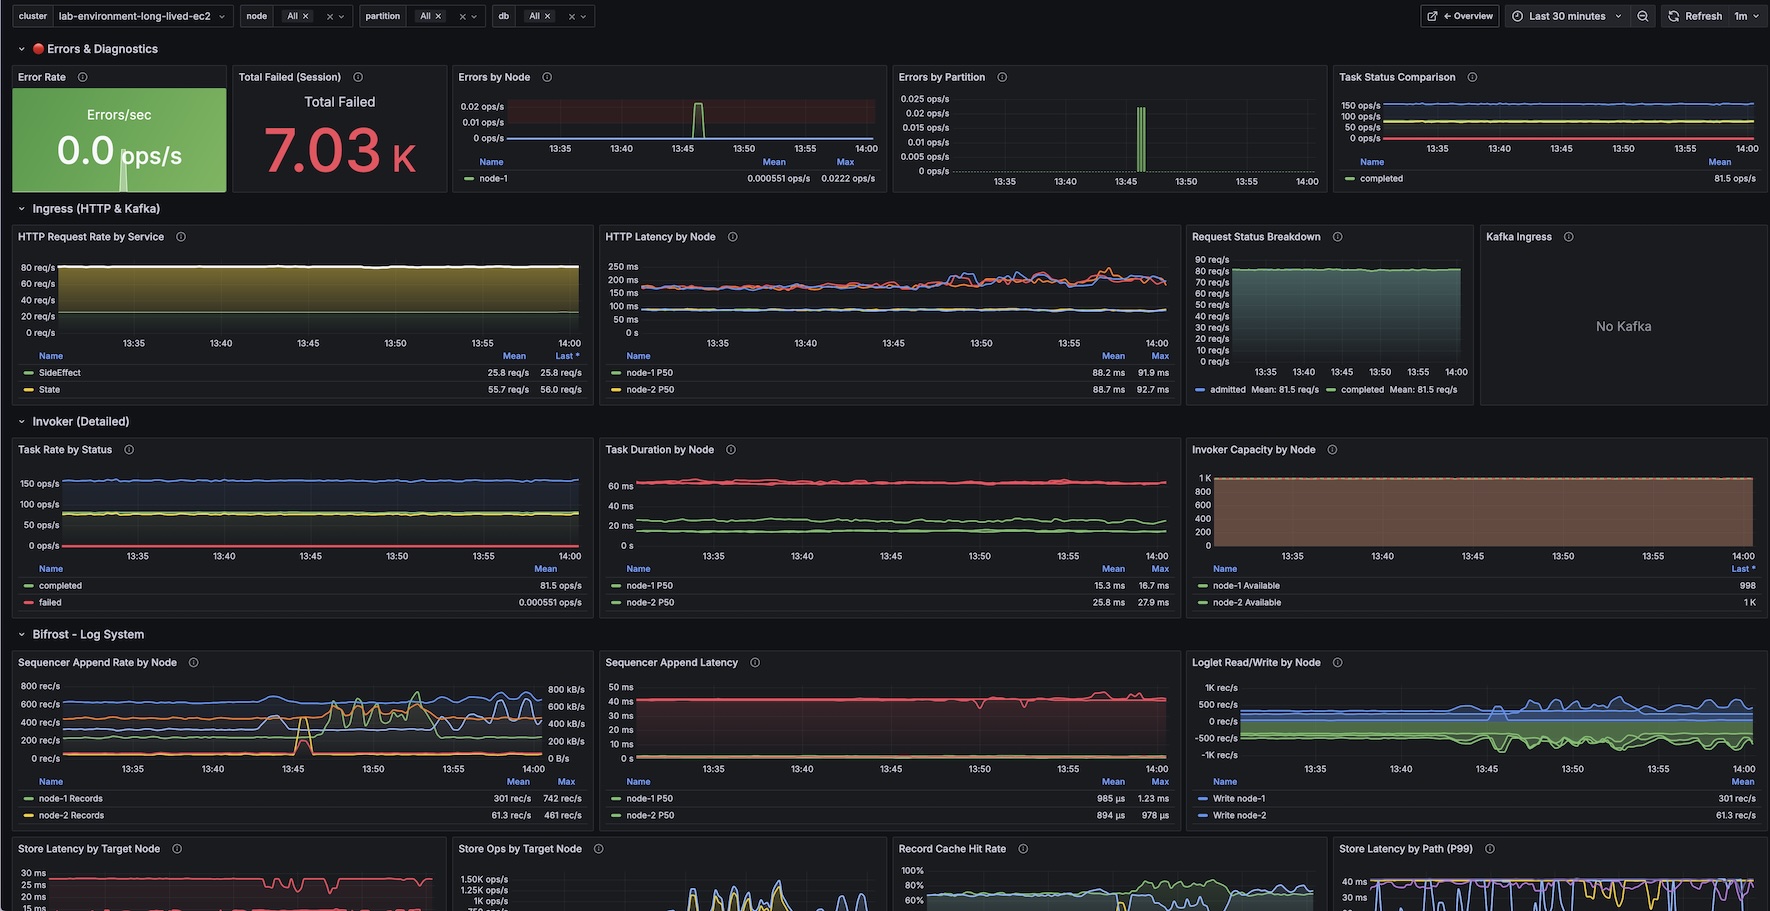
This dashboard provides detailed visibility into Restate Server internals for troubleshooting and performance analysis. Use it alongside the Restate: Overview dashboard to drill down into specific subsystems.
Sections
- Errors & Diagnostics - Error rates, errors by node and partition, task status comparison
- Ingress (HTTP & Kafka) - Request rates by service, latency percentiles, status breakdown, Kafka consumer lag
- Invoker (Detailed) - Task rates by status, task duration percentiles, invoker capacity per node
- Bifrost - Log System - Sequencer append rates and latency, store latency by target node, record cache hit rate
- Partition Processor - Command processing rate by type, command latency (P99), applied LSN lag
- RocksDB - Read/write ops, get/write latencies, block cache hit/miss, compaction activity, LSM tree structure, write stalls
- Metadata Server - Get/put operations, latencies, Raft replication status
Requirements
- Restate Server exposing metrics on
/metrics(default port 5122) - Prometheus scraping Restate metrics
Related Dashboard
For high-level cluster health monitoring, use the companion Restate: Overview dashboard.
Links
Data source config
Collector type:
Collector plugins:
Collector config:
Revisions
Upload an updated version of an exported dashboard.json file from Grafana
| Revision | Description | Created | |
|---|---|---|---|
| Download |