Azure / Insights / PostgreSQL / Flexible Server Monitoring (V2)
Azure Monitor (Grafana) dashboard – Version 2 for Azure Database for PostgreSQL Flexible Server, combining server health and performance metrics (CPU, memory, IOPS, storage, connections, throughput, latency) with Azure Monitor Logs for metric-to-log correlation and faster root-cause analysis.
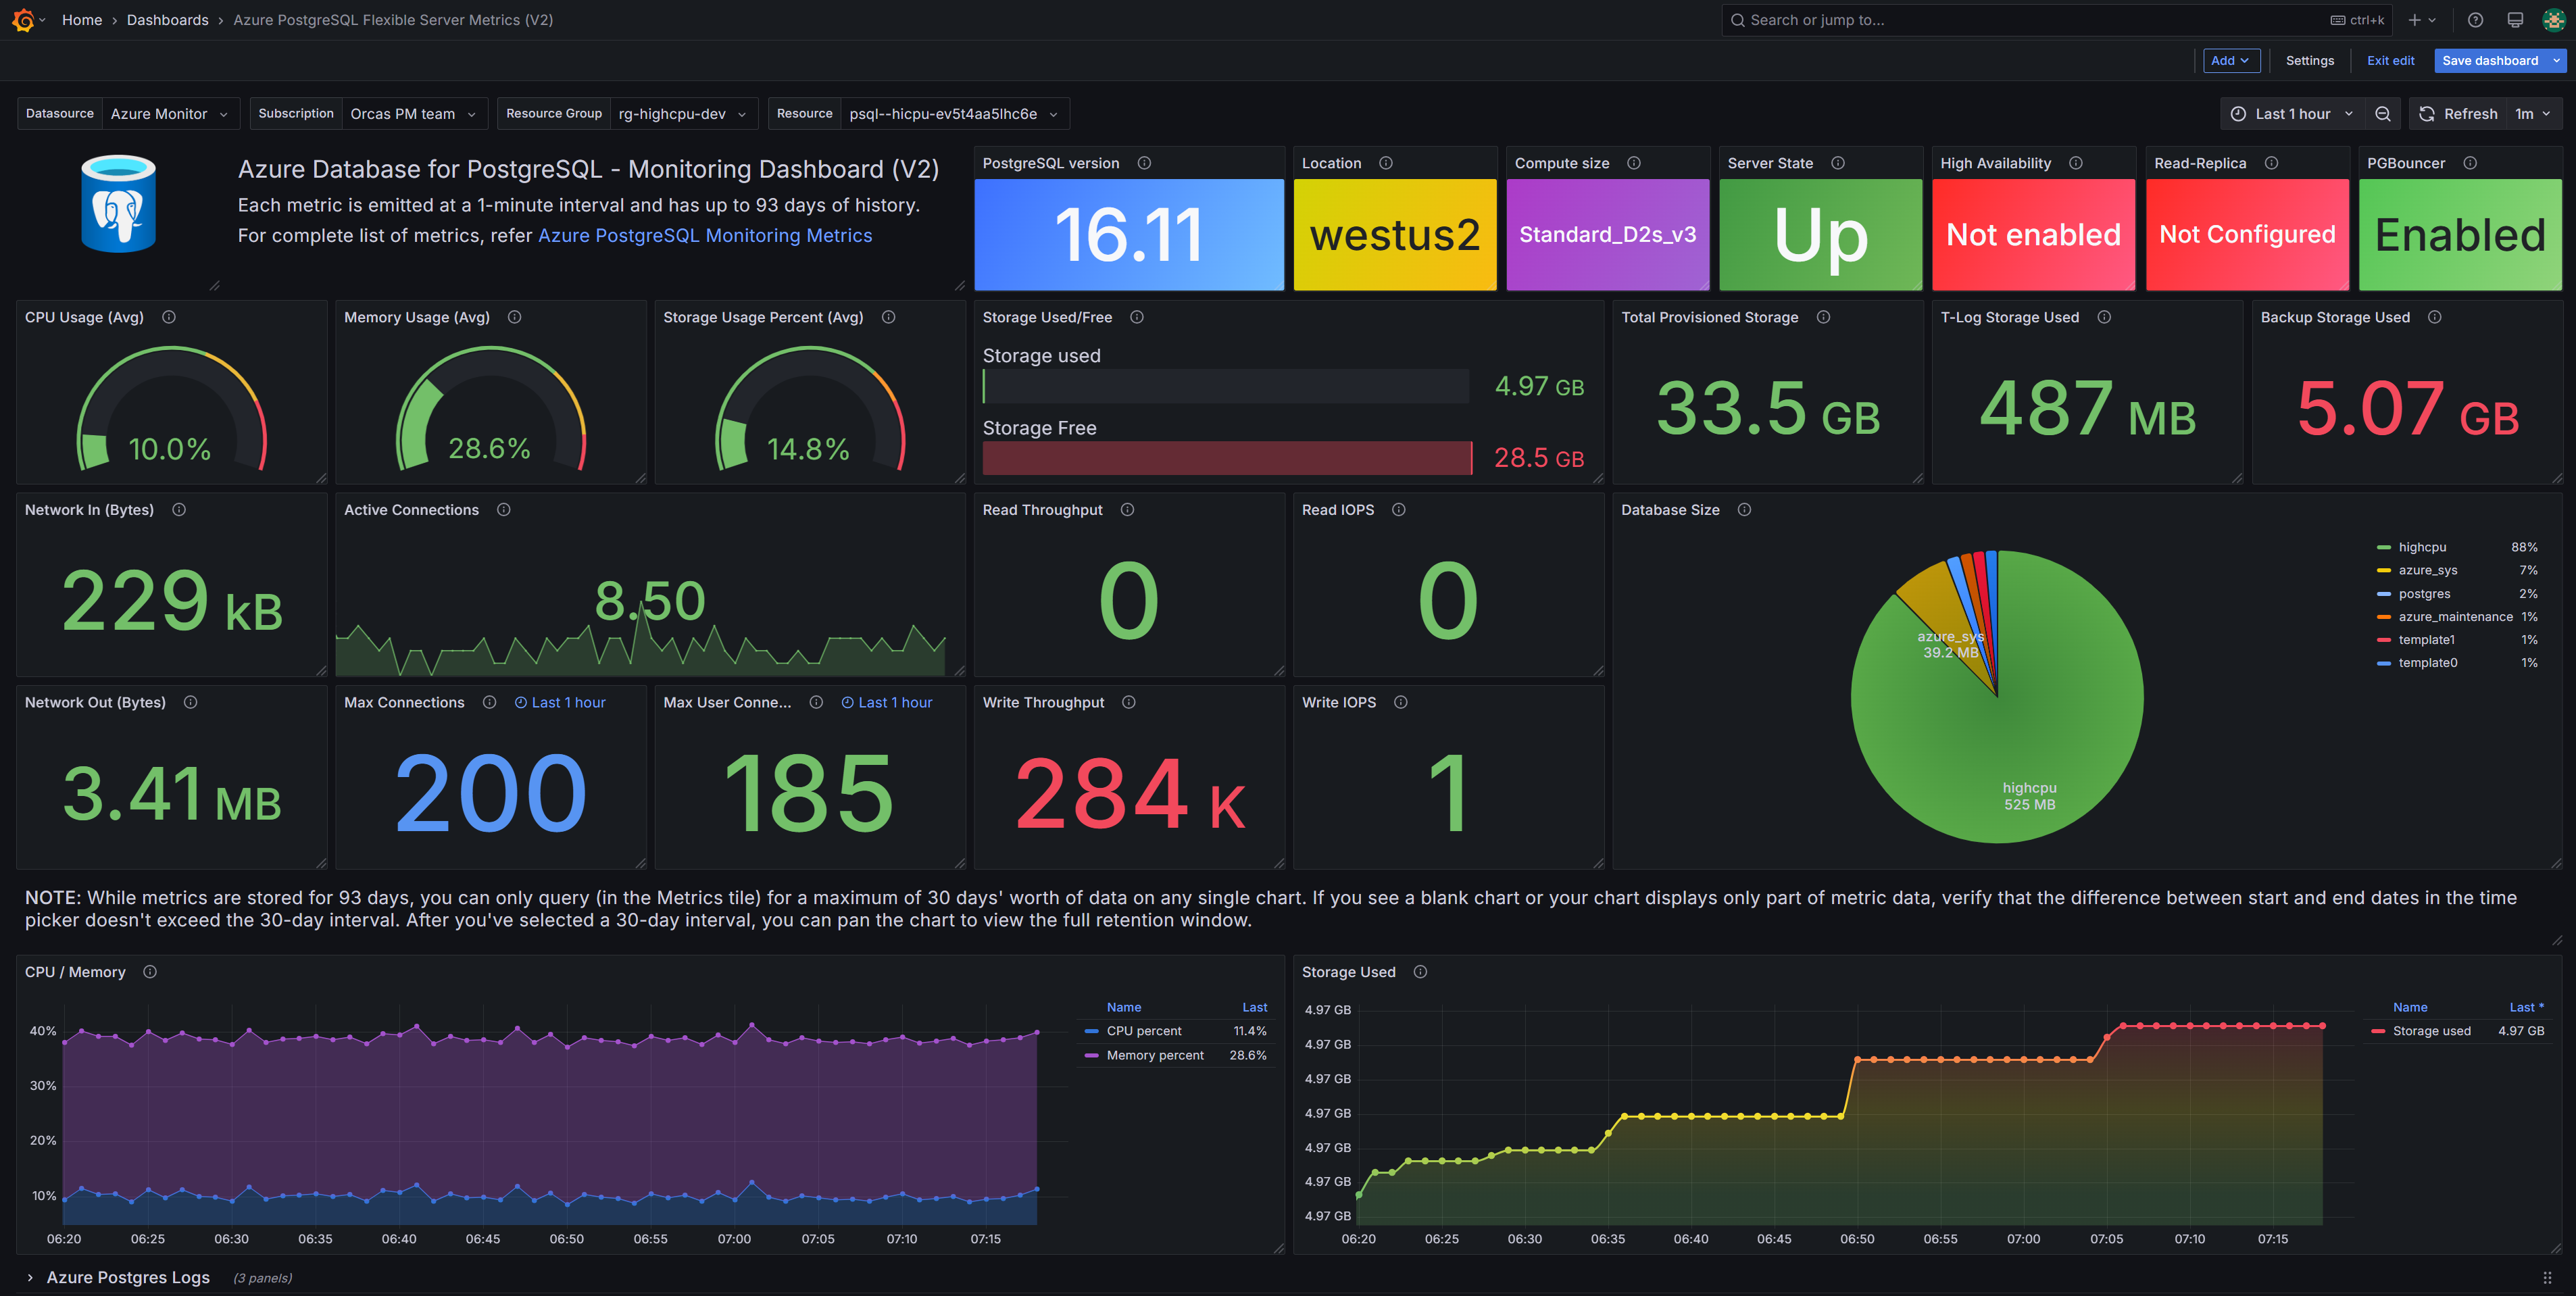
The Azure / Insights / PostgreSQL / Flexible Server Monitoring (V2) dashboard uses the __expr__ and grafana-azure-monitor-datasource data sources to create a Grafana dashboard with the bargauge, gauge, piechart, stat, table, text and timeseries panels.
Data source config
Collector type:
Collector plugins:
Collector config:
Revisions
Upload an updated version of an exported dashboard.json file from Grafana
| Revision | Description | Created | |
|---|---|---|---|
| Download |
Azure Cosmos DB
With the Grafana plugin for Azure Cosmos DB, you can quickly visualize and query your Azure Cosmos DB data from within Grafana.
Learn more