SpringBoot API 指标监控
Spring Boot API 指标监控
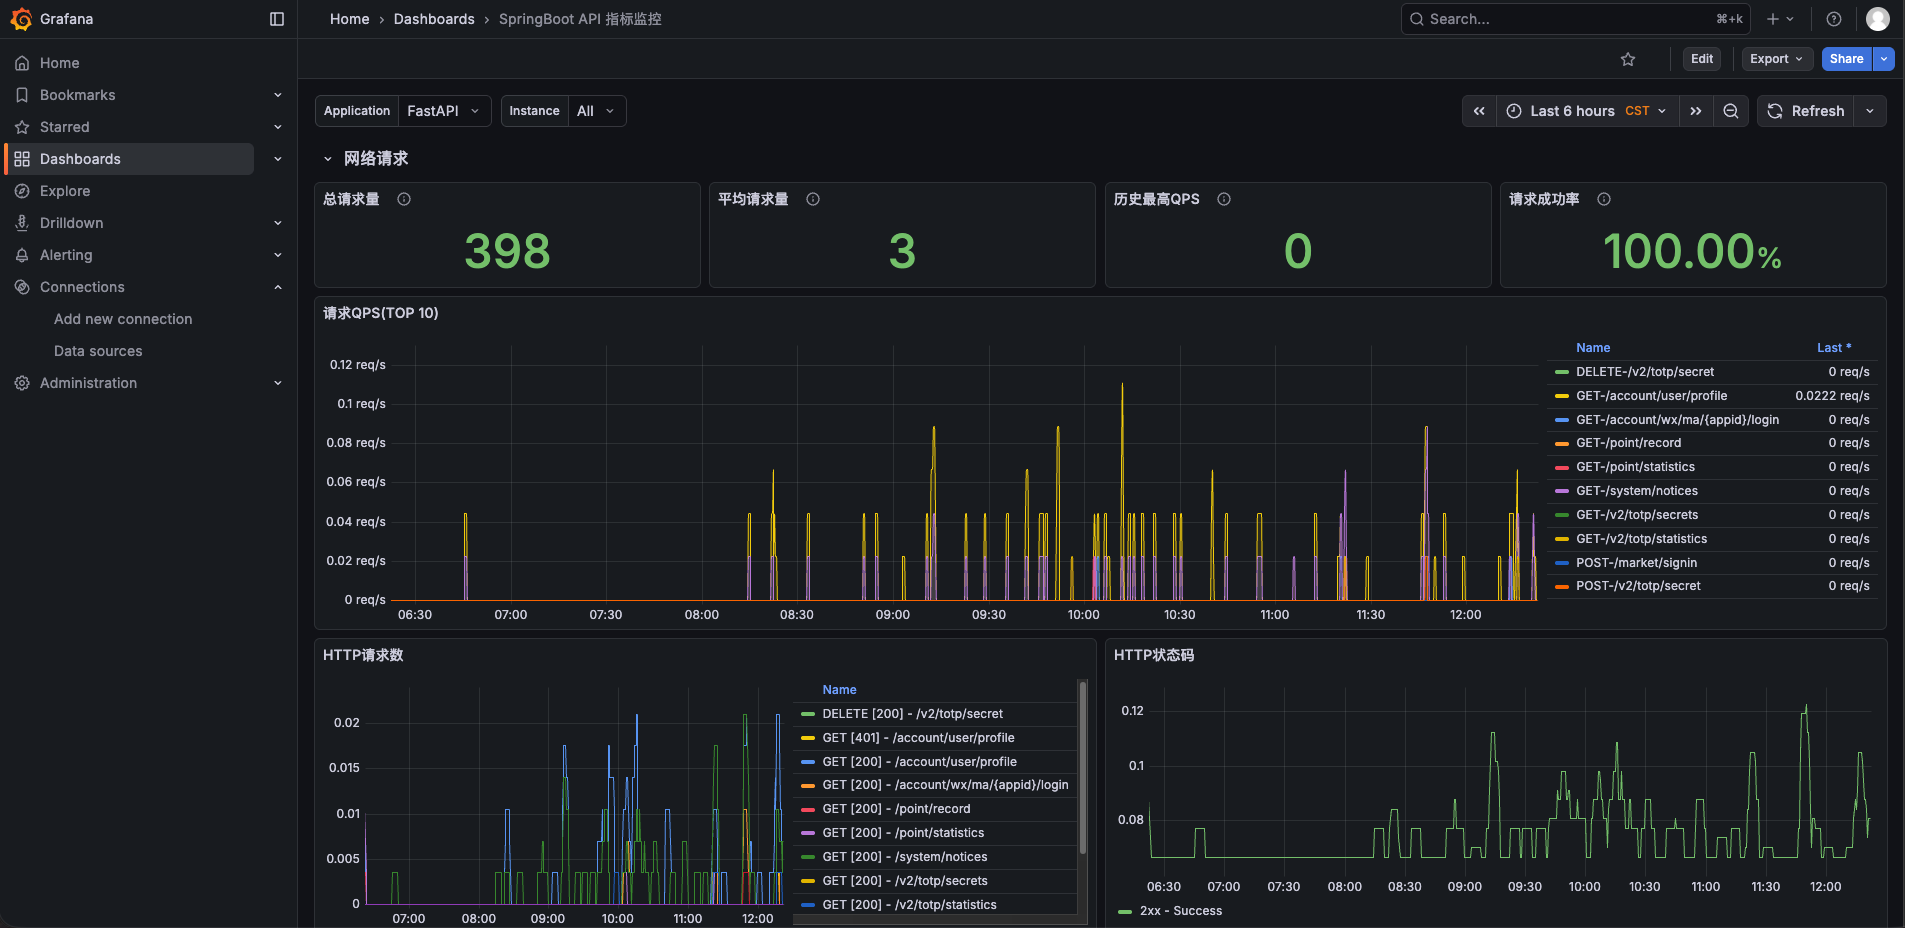
4. 监控 Spring Boot 应用
- job_name: springboot
metrics_path: '/actuator/prometheus'
static_configs:
- targets:
- '192.168.0.2:8080'
- targets:
Data source config
Collector type:
Collector plugins:
Collector config:
Revisions
Upload an updated version of an exported dashboard.json file from Grafana
| Revision | Description | Created | |
|---|---|---|---|
| Download |