k6 Load Test Dashboard (InfluxDB v1.x)
A dashboard for visualizing results from the k6.io load testing tool, using the InfluxDB exporter
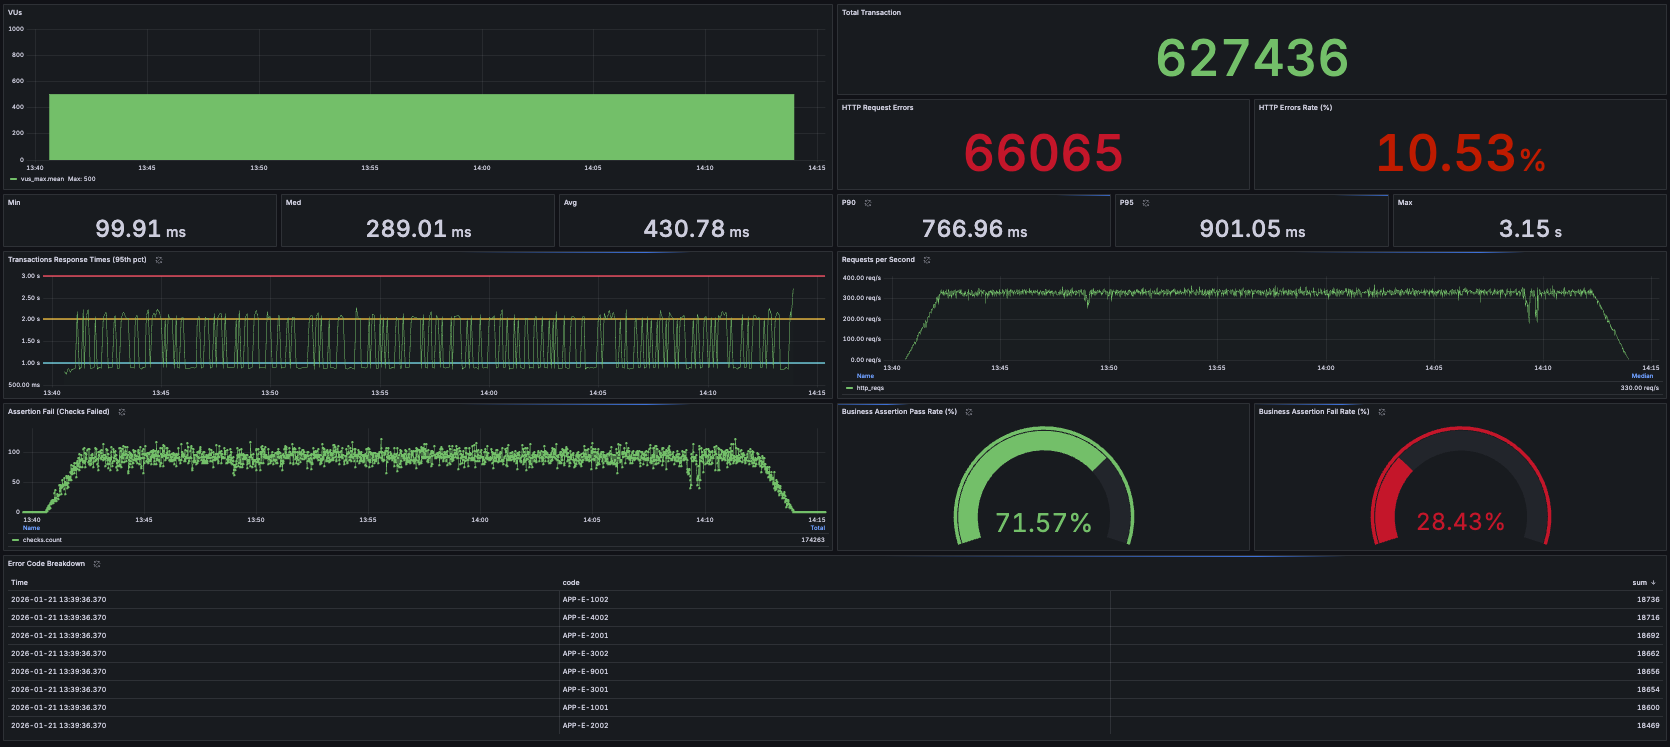
k6 Load Testing Dashboard (InfluxDB v1.x)
Grafana dashboard for visualizing k6 load test results using InfluxDB 1.x (InfluxQL).
This dashboard is designed for users running k6 with InfluxDB v1.x, and has been tested with InfluxDB 1.7.4.
📊 Metrics Included
- HTTP Request Duration (Avg / P95 / P99)
- Requests per Second (RPS)
- Error Rate
- Iterations
- Virtual Users (using
vus_max) - Data Received / Sent
🧱 Requirements
- k6
- InfluxDB 1.7.x – 1.8.x
- Grafana 8+
- Query Language: InfluxQL
⚠️ Not compatible with InfluxDB 2.x (Flux)
🚀 How to Use
1. Run k6 with InfluxDB output
k6 run --out influxdb=http://localhost:8086/k6 script.js
2. Configure InfluxDB Data Source in Grafana
- URL:
http://localhost:8086 - Database:
k6 - Query Language: InfluxQL
3. Import Dashboard
You can import this dashboard in two ways:
Option A: Import by Dashboard ID (Recommended)
- Open Grafana
- Go to Dashboards → + Import
- Enter Dashboard ID: 24720
- Click Load
- Select your InfluxDB (v1.x) data source
- Click Import 🎉
Option B: Import by JSON File
- Open Grafana
- Go to Dashboards → + Import
- Upload dashboards/k6-load-testing-dashboard.json
- Select your InfluxDB (v1.x) data source
- Click Import 🎉
ℹ️ Notes
InfluxDB Version
- This dashboard uses InfluxQL
- It relies on the InfluxDB 1.x schema
- It will not work with InfluxDB 2.x without major changes
Virtual Users Metric
k6 does not always emit a real-time vus metric in InfluxDB.
This dashboard uses:
vus_max— the maximum number of virtual users allocated during the test
This ensures compatibility with most k6 executors.
Compatibility
- ✅ InfluxDB 1.7.x – 1.8.x
- ❌ InfluxDB 2.x (Flux not supported)
Tested With
- k6
- InfluxDB 1.7.4
- Grafana 8+
Data source config
Collector type:
Collector plugins:
Collector config:
Revisions
Upload an updated version of an exported dashboard.json file from Grafana
| Revision | Description | Created | |
|---|---|---|---|
| Download |