Raspberry Pi Cluster Monitoring
Prometheus-powered monitoring for Raspberry Pi clusters, providing insights into performance, resource utilization, and node health.
Raspberry Pi Cluster Monitoring Dashboard
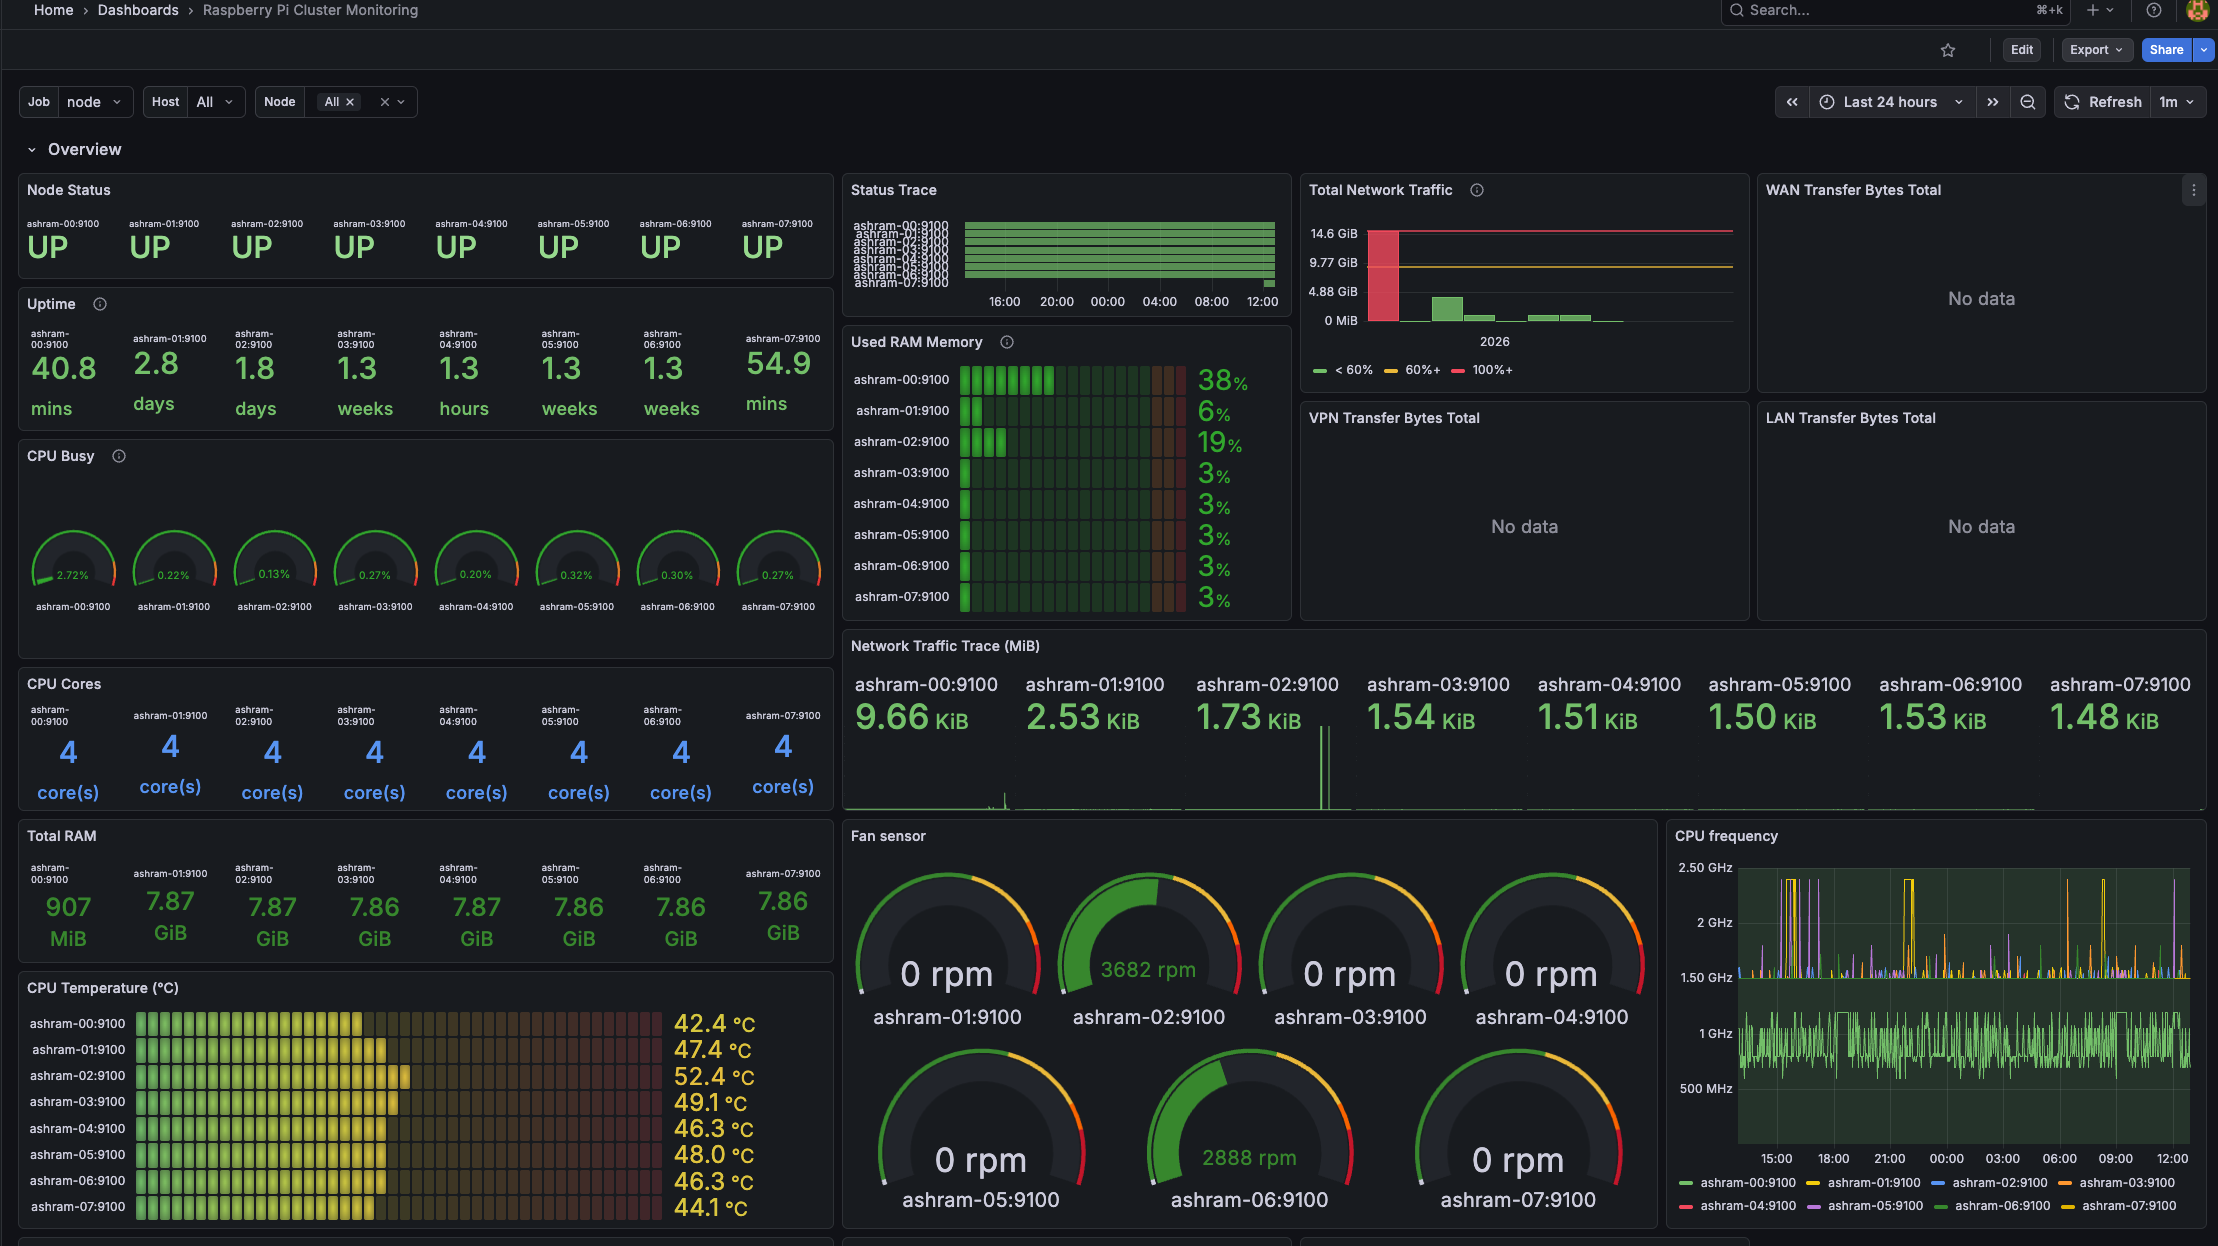
This dashboard provides real-time and historical visibility into the health and performance of a Raspberry Pi cluster. It is designed to help monitor system load, resource utilization, and node availability across all Pi nodes in the cluster.
📊 What This Dashboard Shows
The dashboard visualizes key system metrics for each Raspberry Pi node, including:
CPU Usage Overall CPU utilization, per-core usage, and system load averages.
Memory Usage Total, used, free, and cached memory to help identify memory pressure.
Disk Usage & I/O Filesystem utilization, read/write throughput, and disk latency.
Network Traffic Incoming and outgoing network bandwidth per interface.
Node Health Node uptime, availability, and basic system status indicators.
These metrics allow quick identification of overloaded nodes, hardware bottlenecks, or failing components within the cluster.
Data source config
Collector config:
Upload an updated version of an exported dashboard.json file from Grafana
| Revision | Description | Created | |
|---|---|---|---|
| Download |
Raspberry Pi
Easily monitor Raspberry Pi, the small, single-board computers, with Grafana Cloud's out-of-the-box monitoring solution.
Learn more