Pod 资源使用情况(按Node | Table)
此dashboard可按节点筛选查看所有节点上运行的所有pod的cpu、内存、磁盘、网络的使用情况
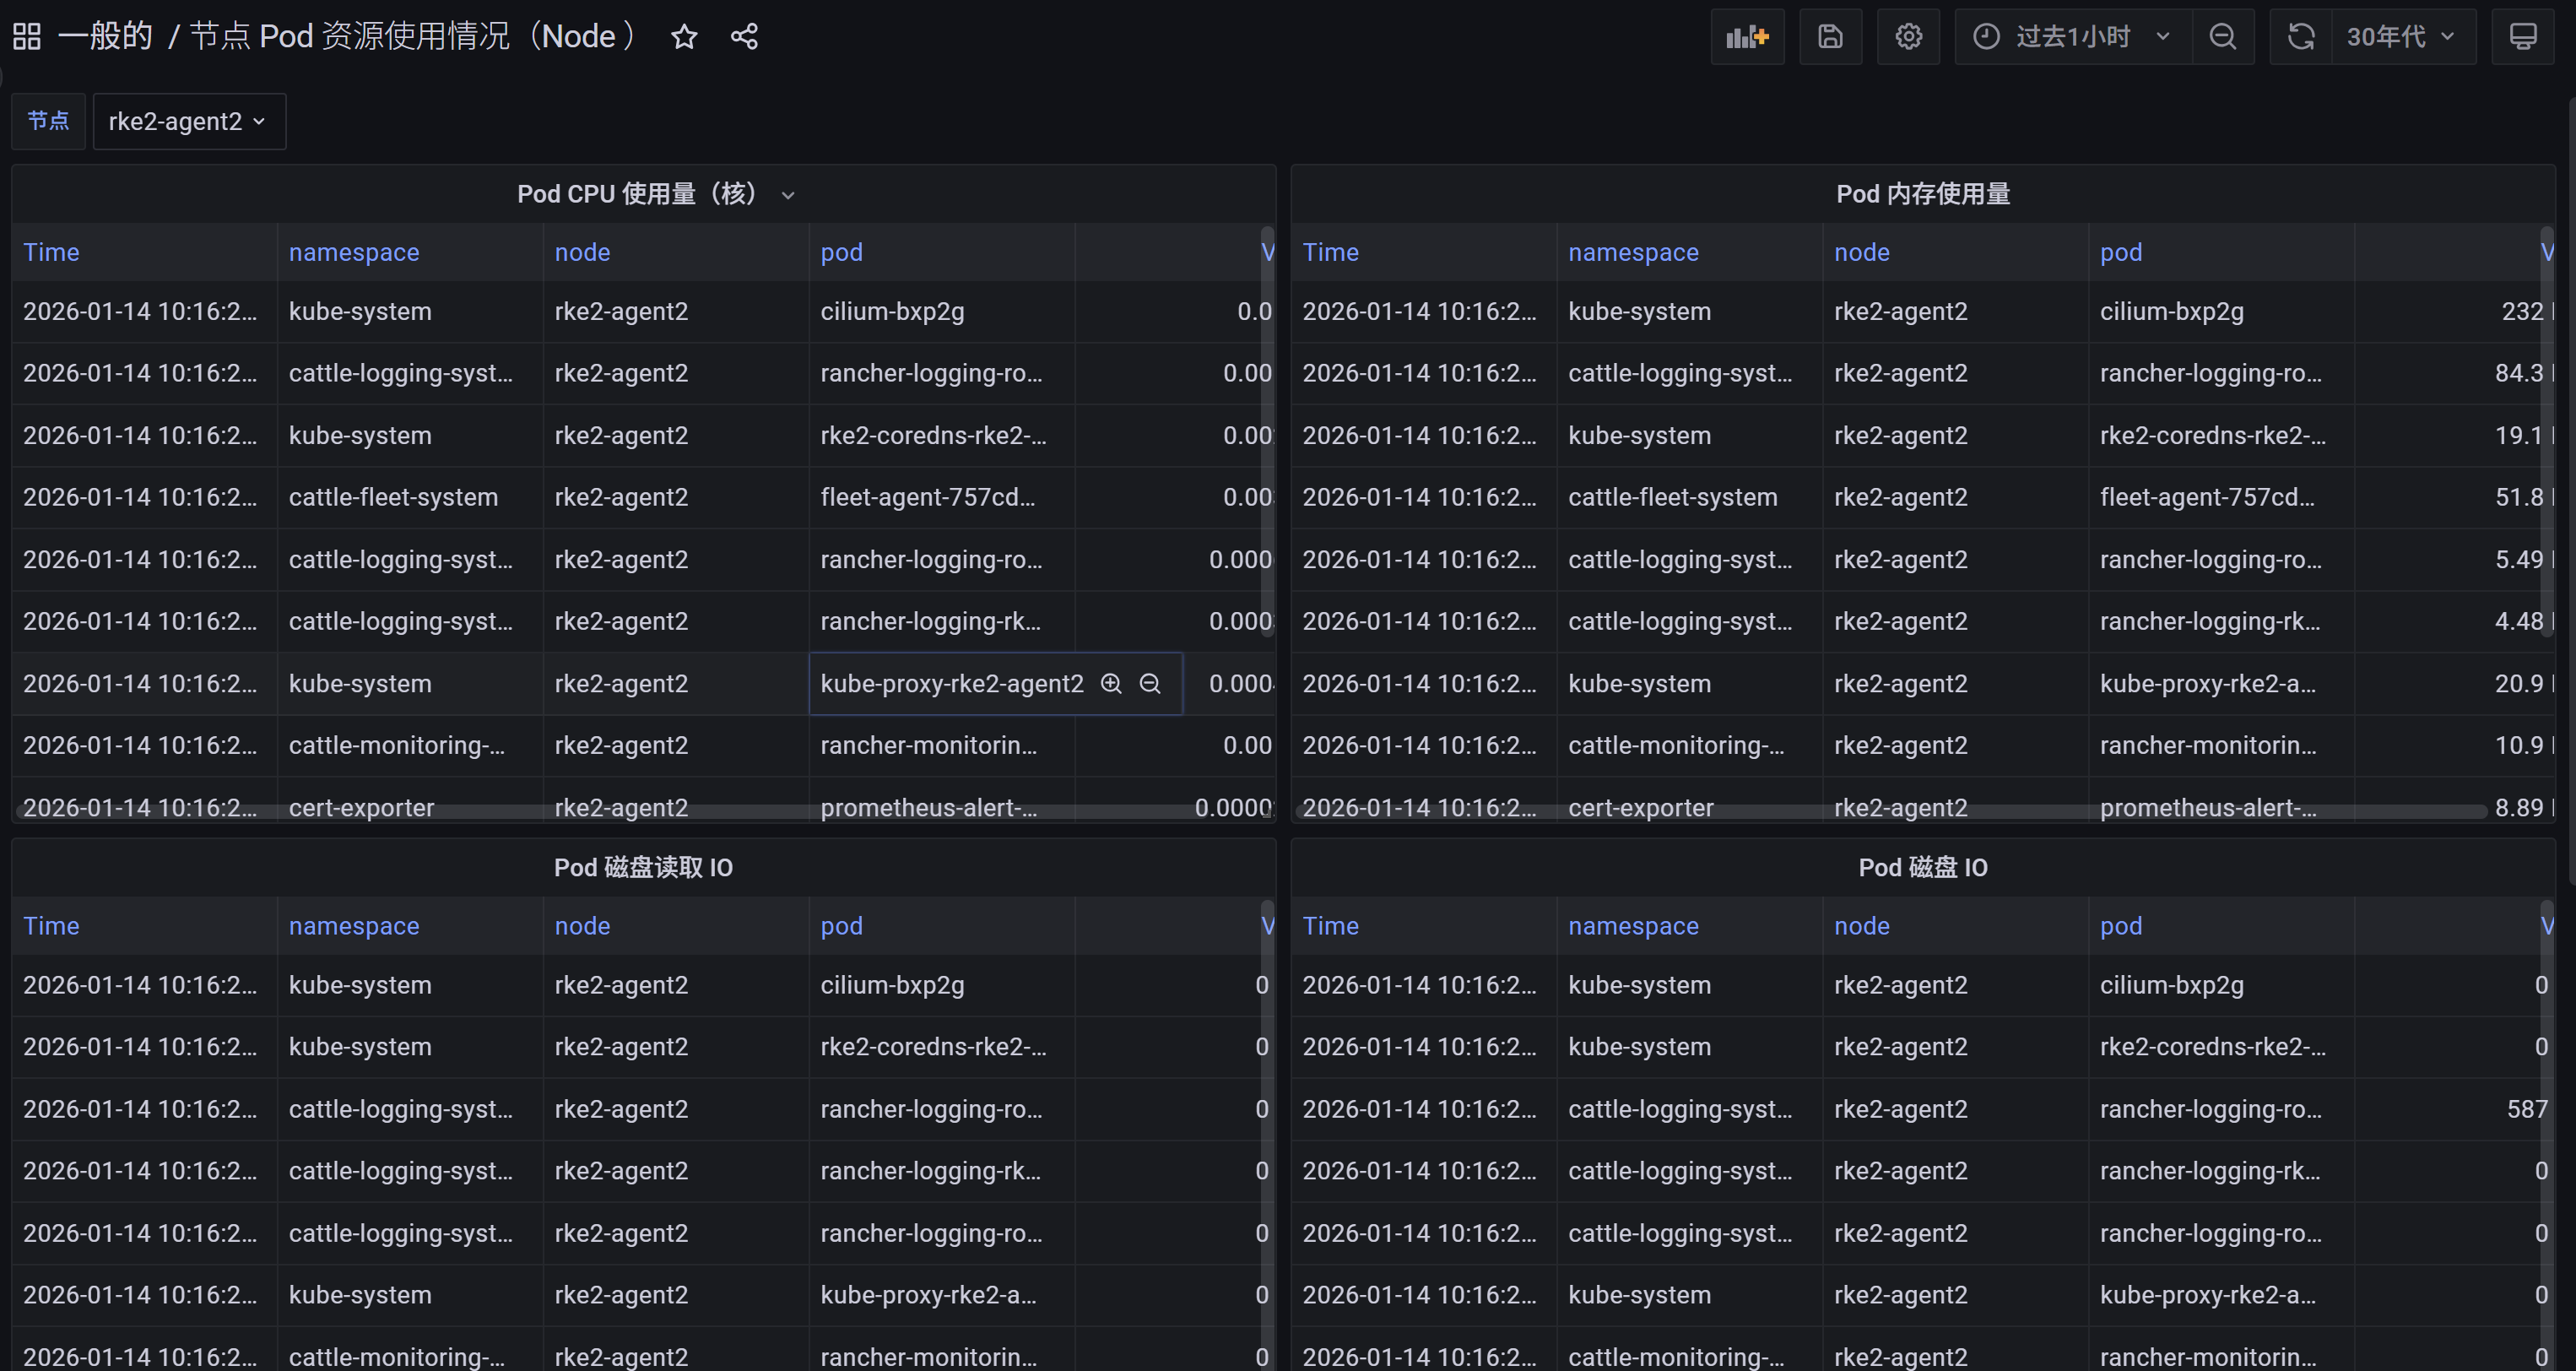
The Pod 资源使用情况(按Node | Table) dashboard uses the prometheus data source to create a Grafana dashboard with the table panel.
Data source config
Collector type:
Collector plugins:
Collector config:
Revisions
Upload an updated version of an exported dashboard.json file from Grafana
| Revision | Description | Created | |
|---|---|---|---|
| Download |