Pod 资源使用TOP排名(按命名空间 | Table)
此dashboard可用于按命名空间统计并排名 Pod 的 CPU、内存、磁盘 IO、网络流量等资源使用 TOP N,帮助快速定位资源消耗异常的 Pod。
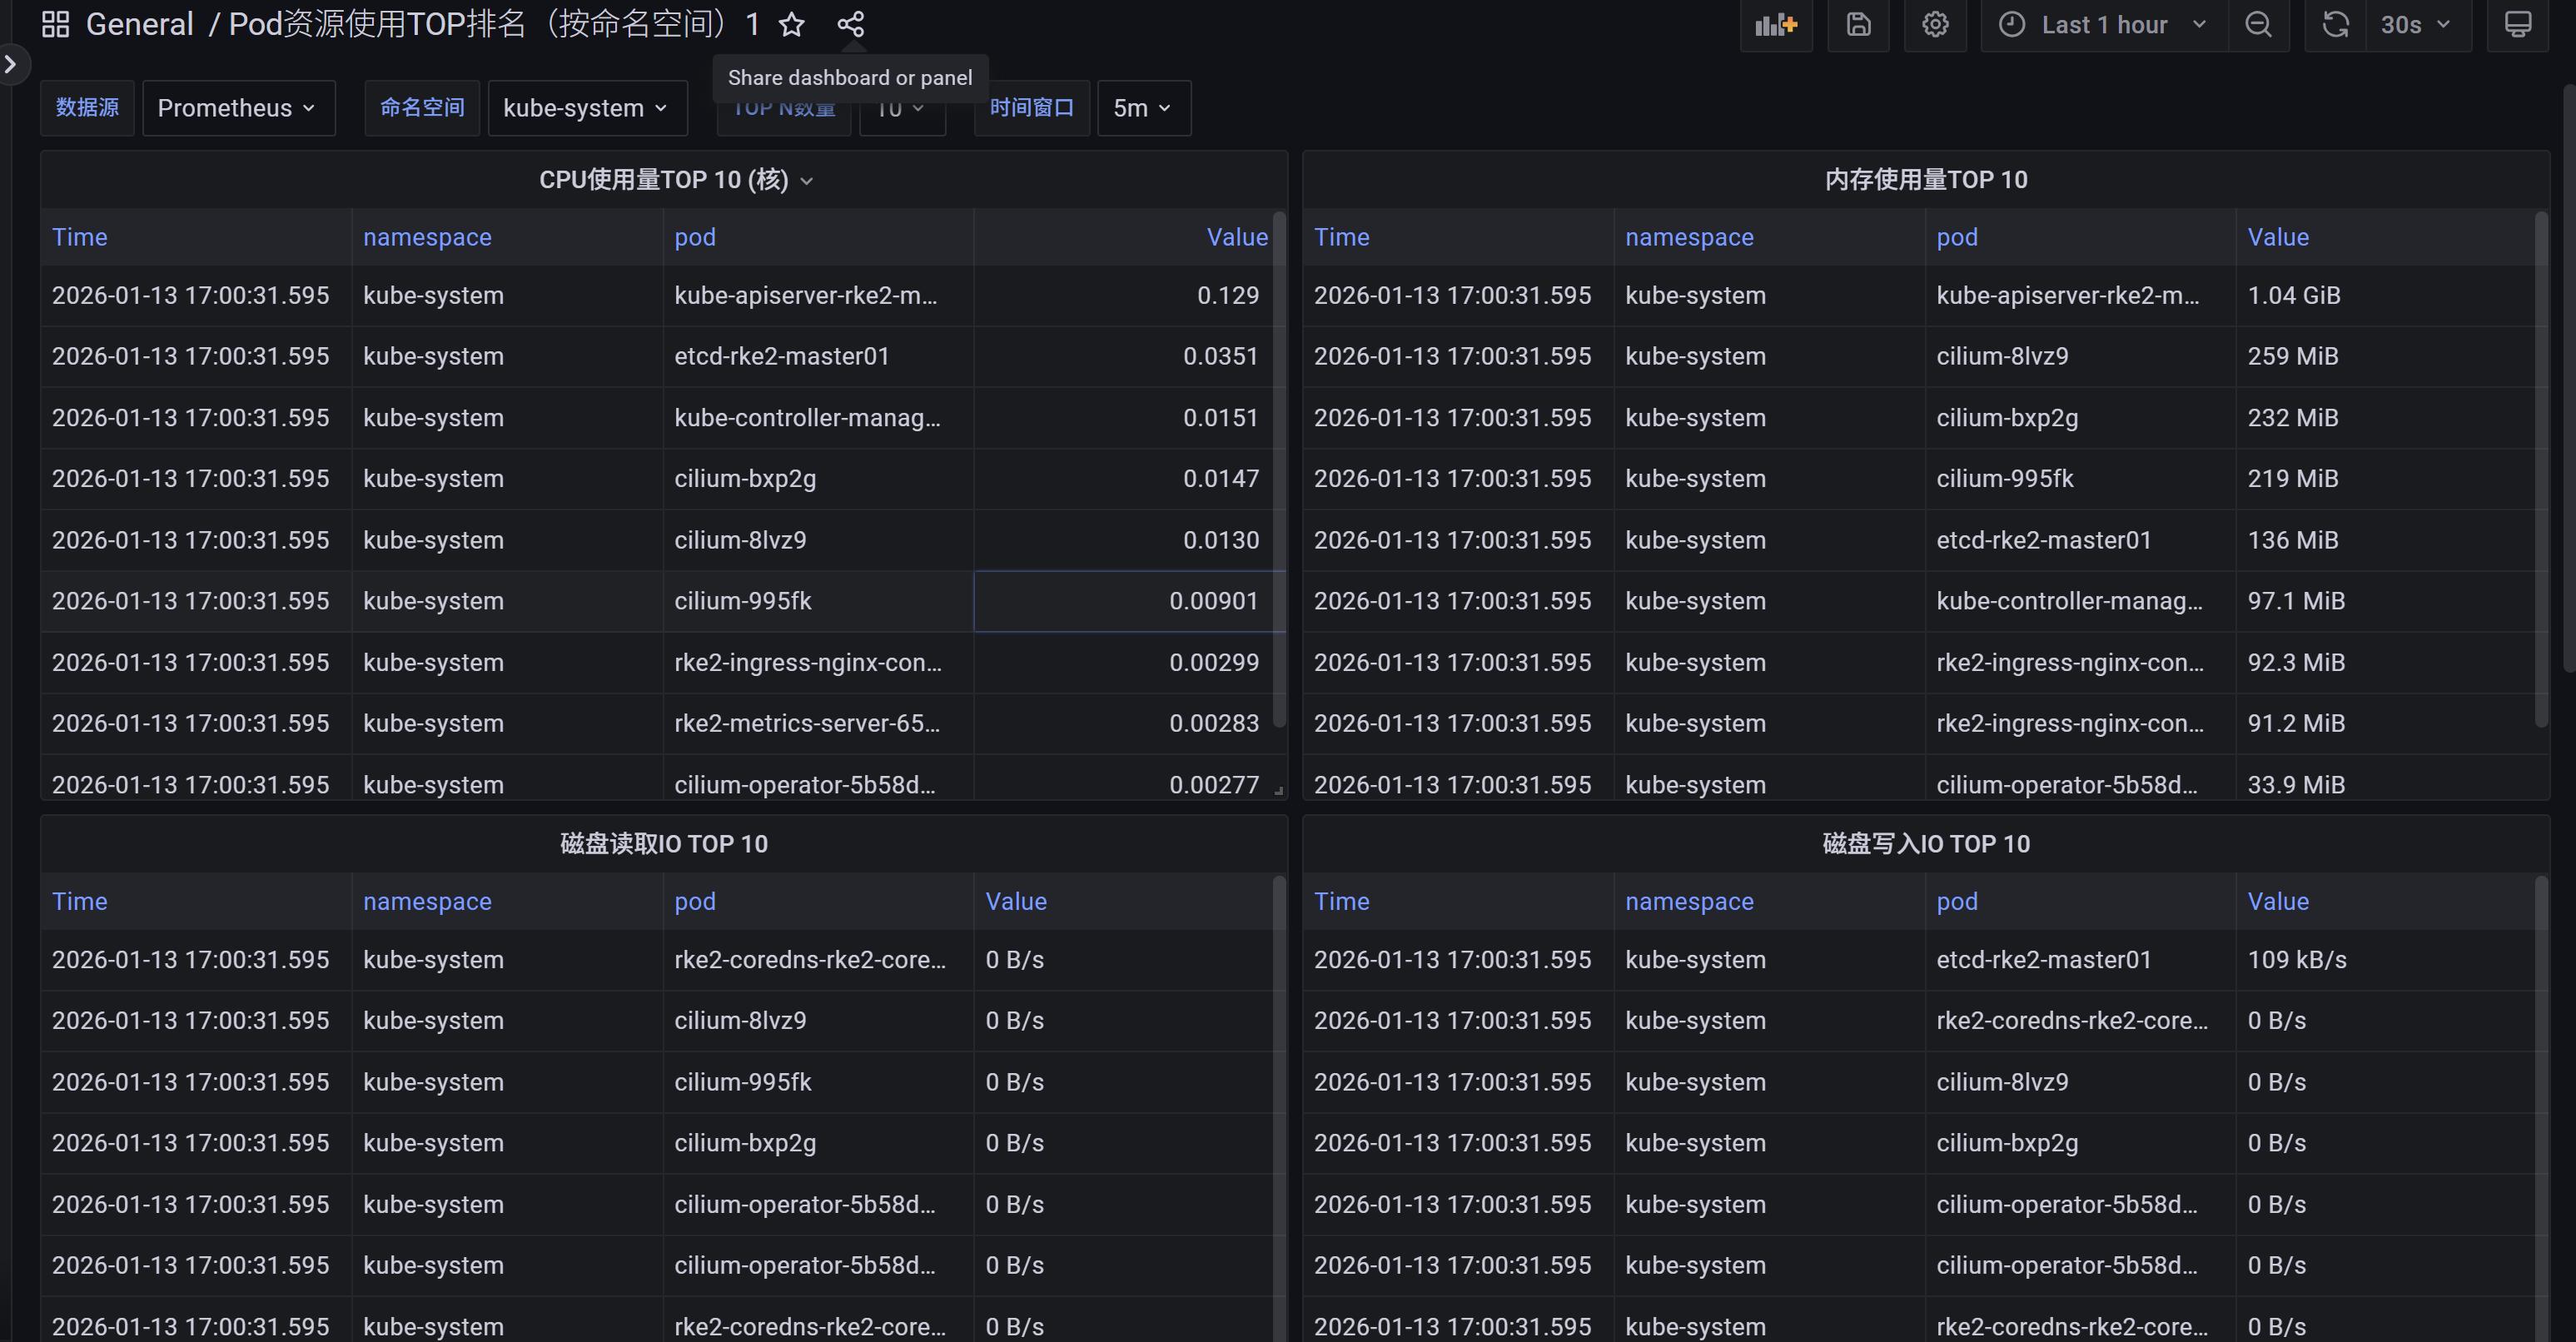
The Pod 资源使用TOP排名(按命名空间 | Table) dashboard uses the prometheus data source to create a Grafana dashboard with the table panel.
Data source config
Collector type:
Collector plugins:
Collector config:
Revisions
Upload an updated version of an exported dashboard.json file from Grafana
| Revision | Description | Created | |
|---|---|---|---|
| Download |