Kubernetes Node 性能指标 TopN
此dashboard 可查看k8s集群节点的CPU、内存、磁盘和网络使用情况,并按 Top N 排名显示最消耗资源的 node

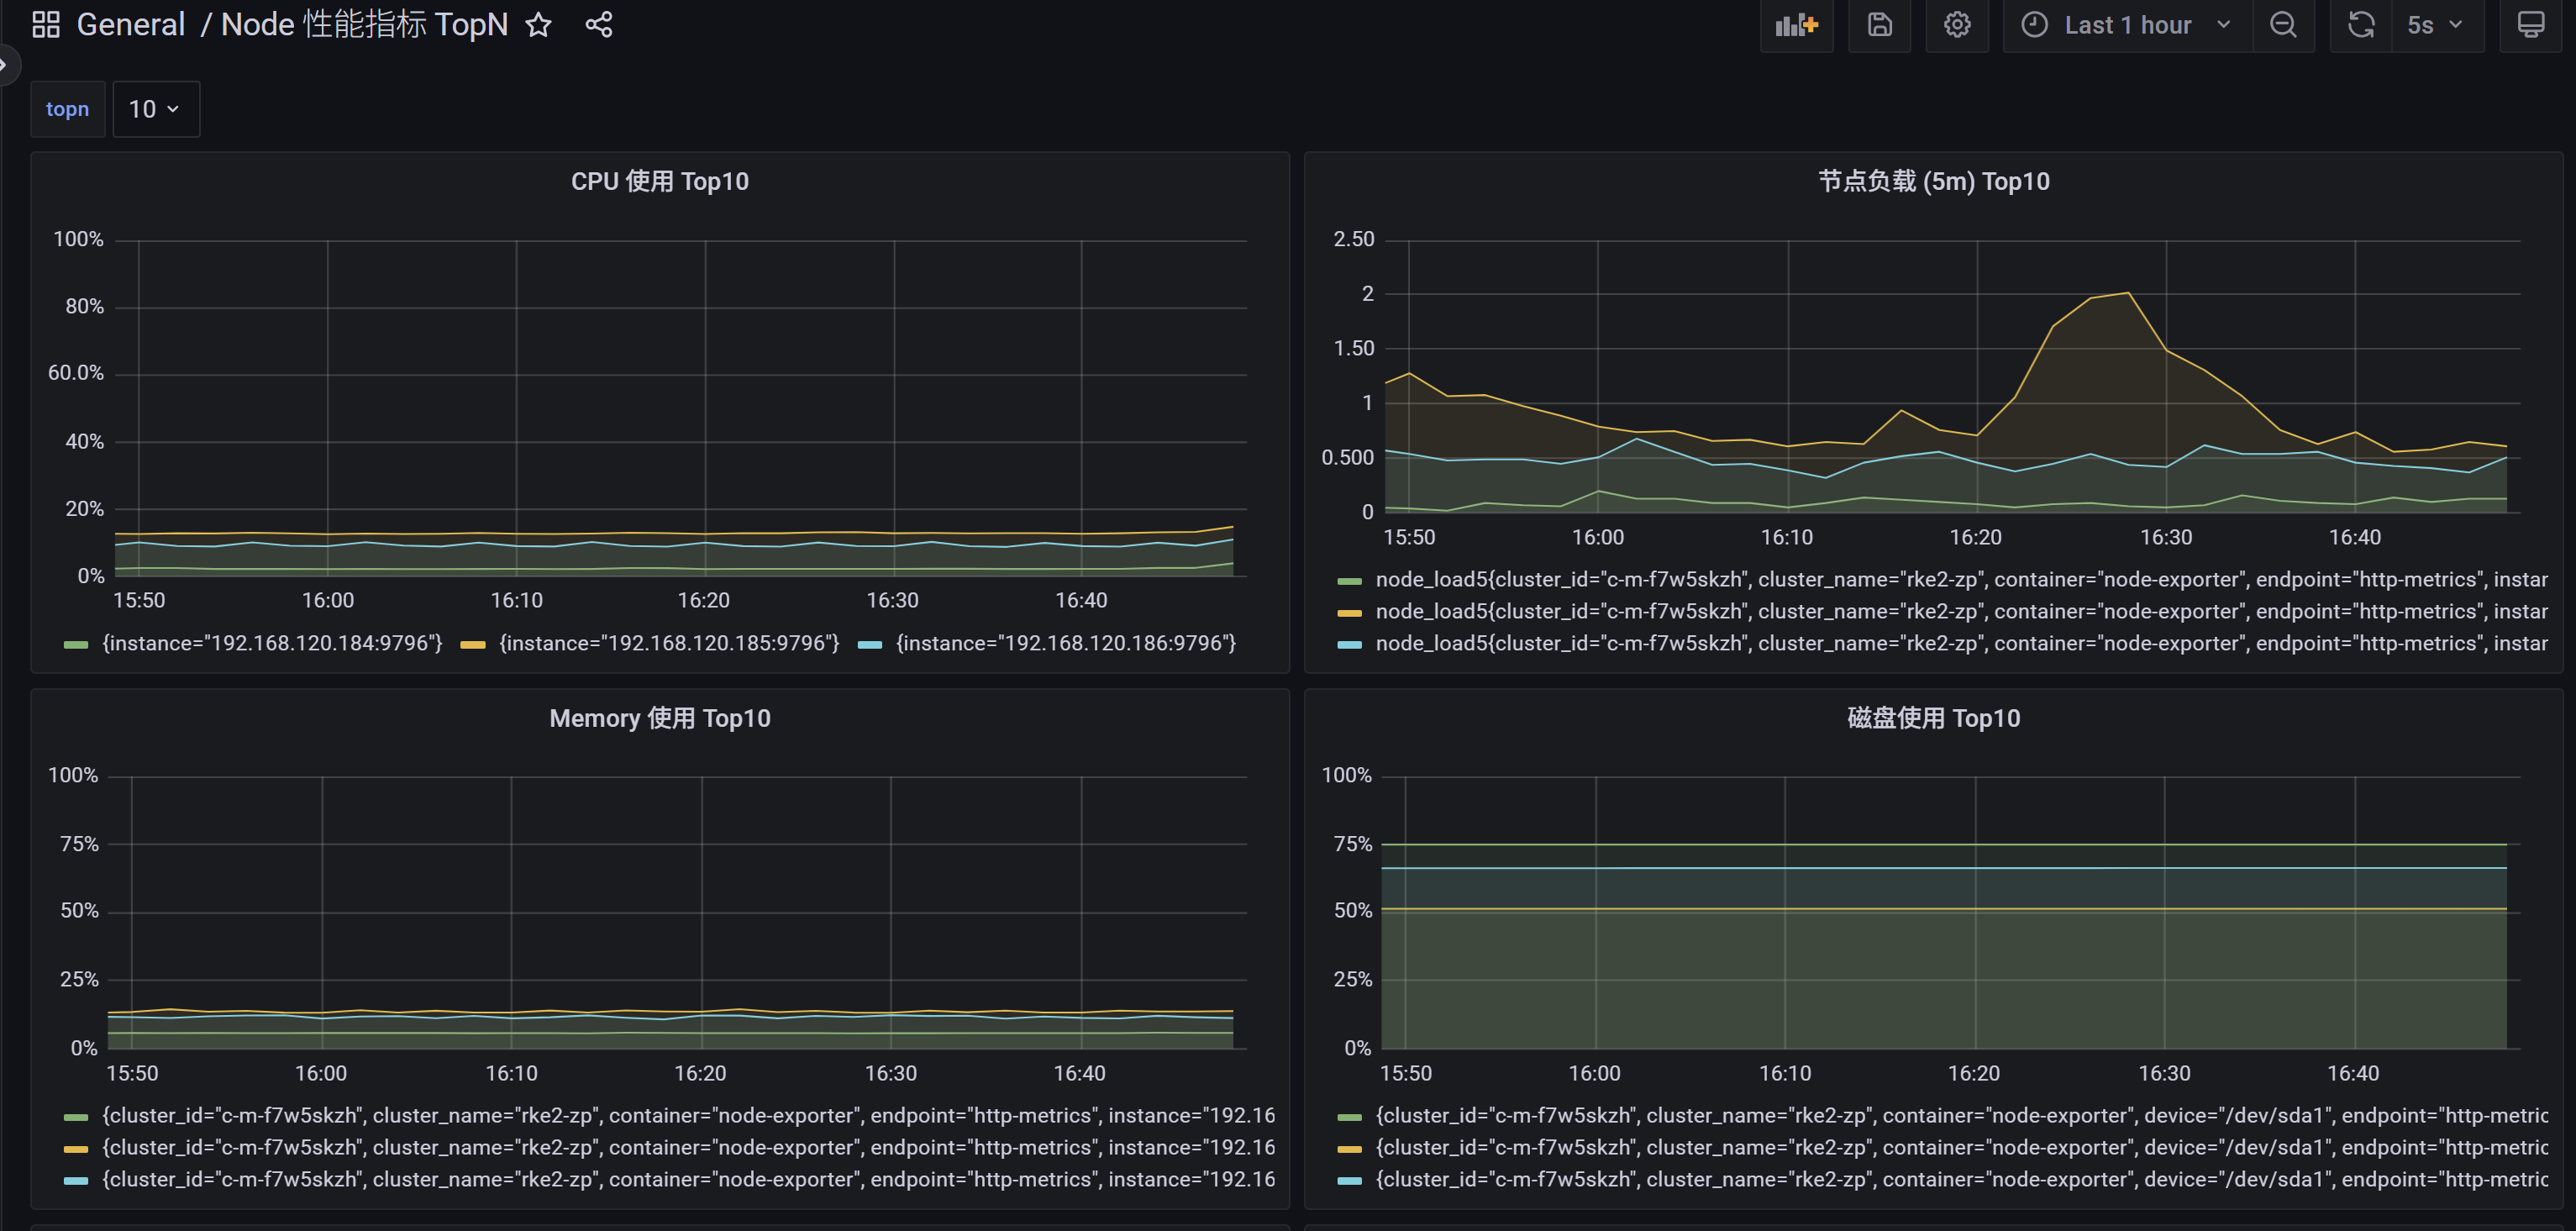
The Kubernetes Node 性能指标 TopN dashboard uses the prometheus data source to create a Grafana dashboard with the graph panel.
Data source config
Collector type:
Collector plugins:
Collector config:
Revisions
Upload an updated version of an exported dashboard.json file from Grafana
| Revision | Description | Created | |
|---|---|---|---|
| Download |
Kubernetes
Monitor your Kubernetes deployment with prebuilt visualizations that allow you to drill down from a high-level cluster overview to pod-specific details in minutes.
Learn more