Windows 检测看板
Windows的Prometheus监控看板展示,增加了资源汇总展示,优化了明细展示。更新支持windows_exporter 0.22.0。
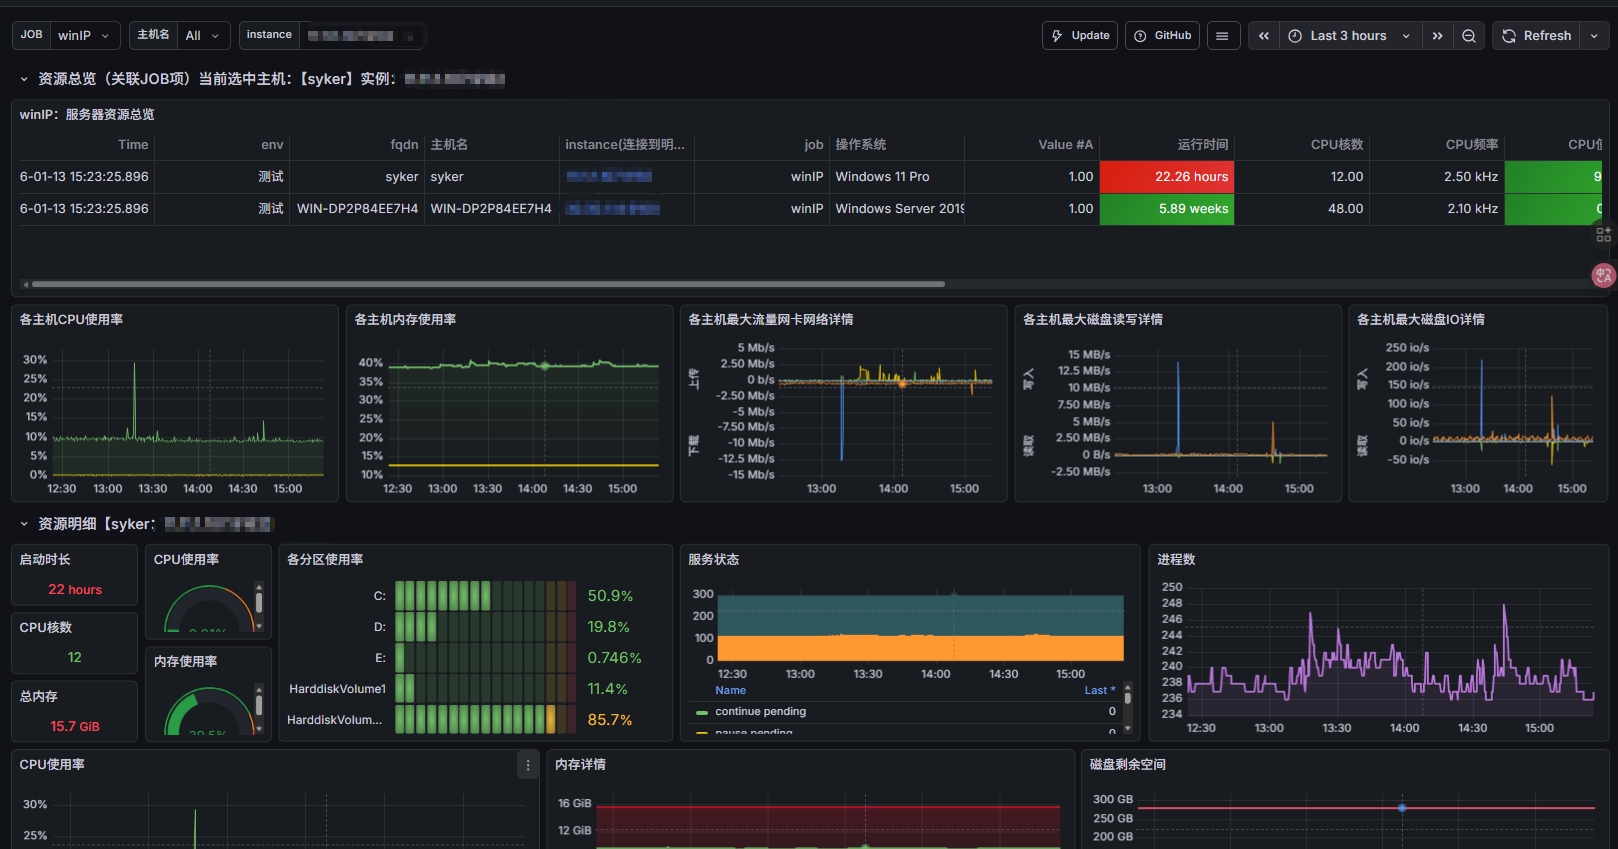
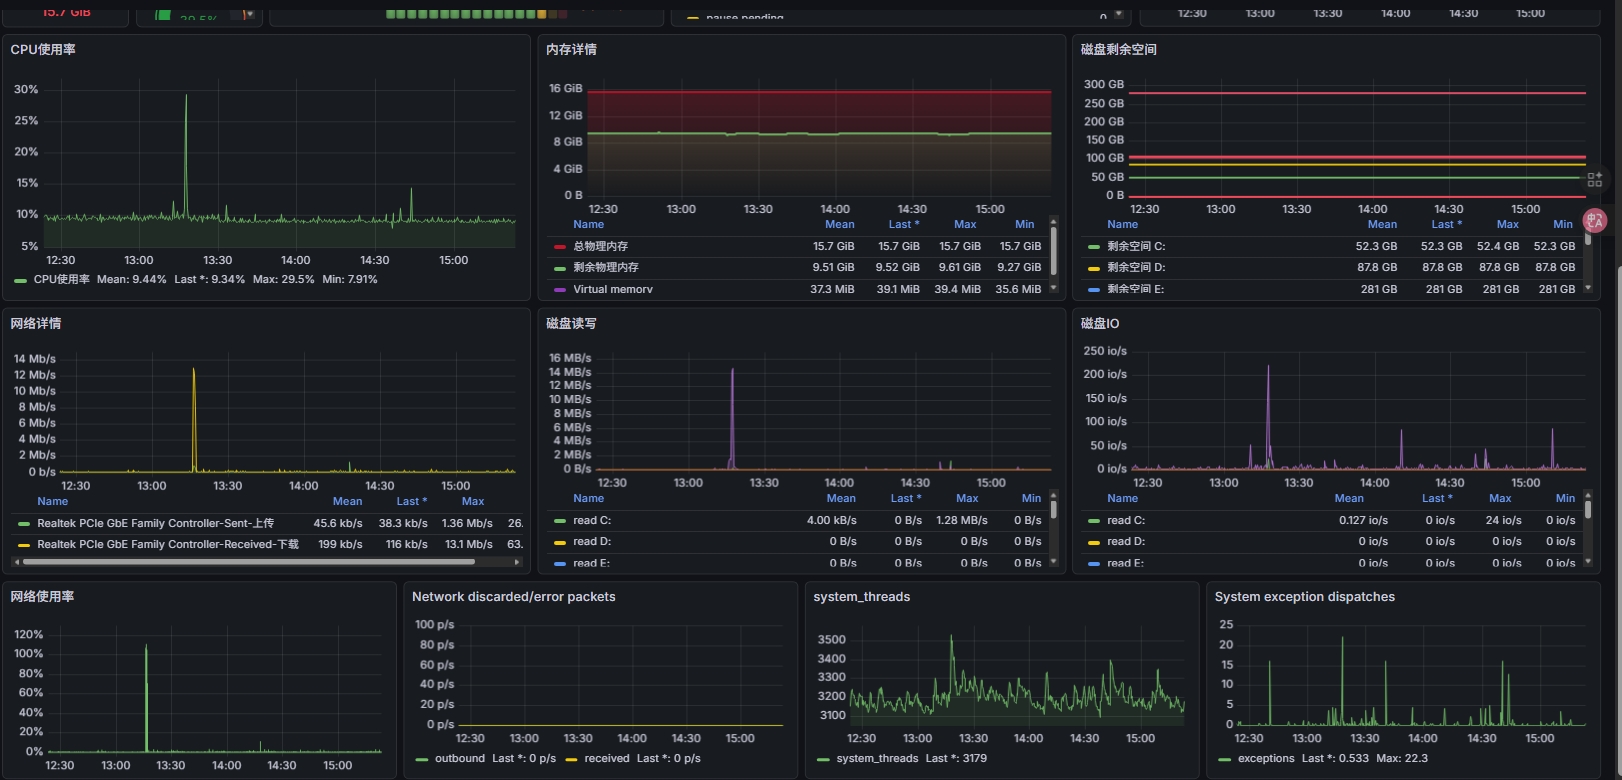
The Windows 检测看板 dashboard uses the prometheus data source to create a Grafana dashboard with the bargauge, gauge, stat, table and timeseries panels.
Data source config
Collector type:
Collector plugins:
Collector config:
Revisions
Upload an updated version of an exported dashboard.json file from Grafana
| Revision | Description | Created | |
|---|---|---|---|
| Download |
Windows
Easily monitor your deployment of the Windows operating system with Grafana Cloud's out-of-the-box monitoring solution.
Learn more