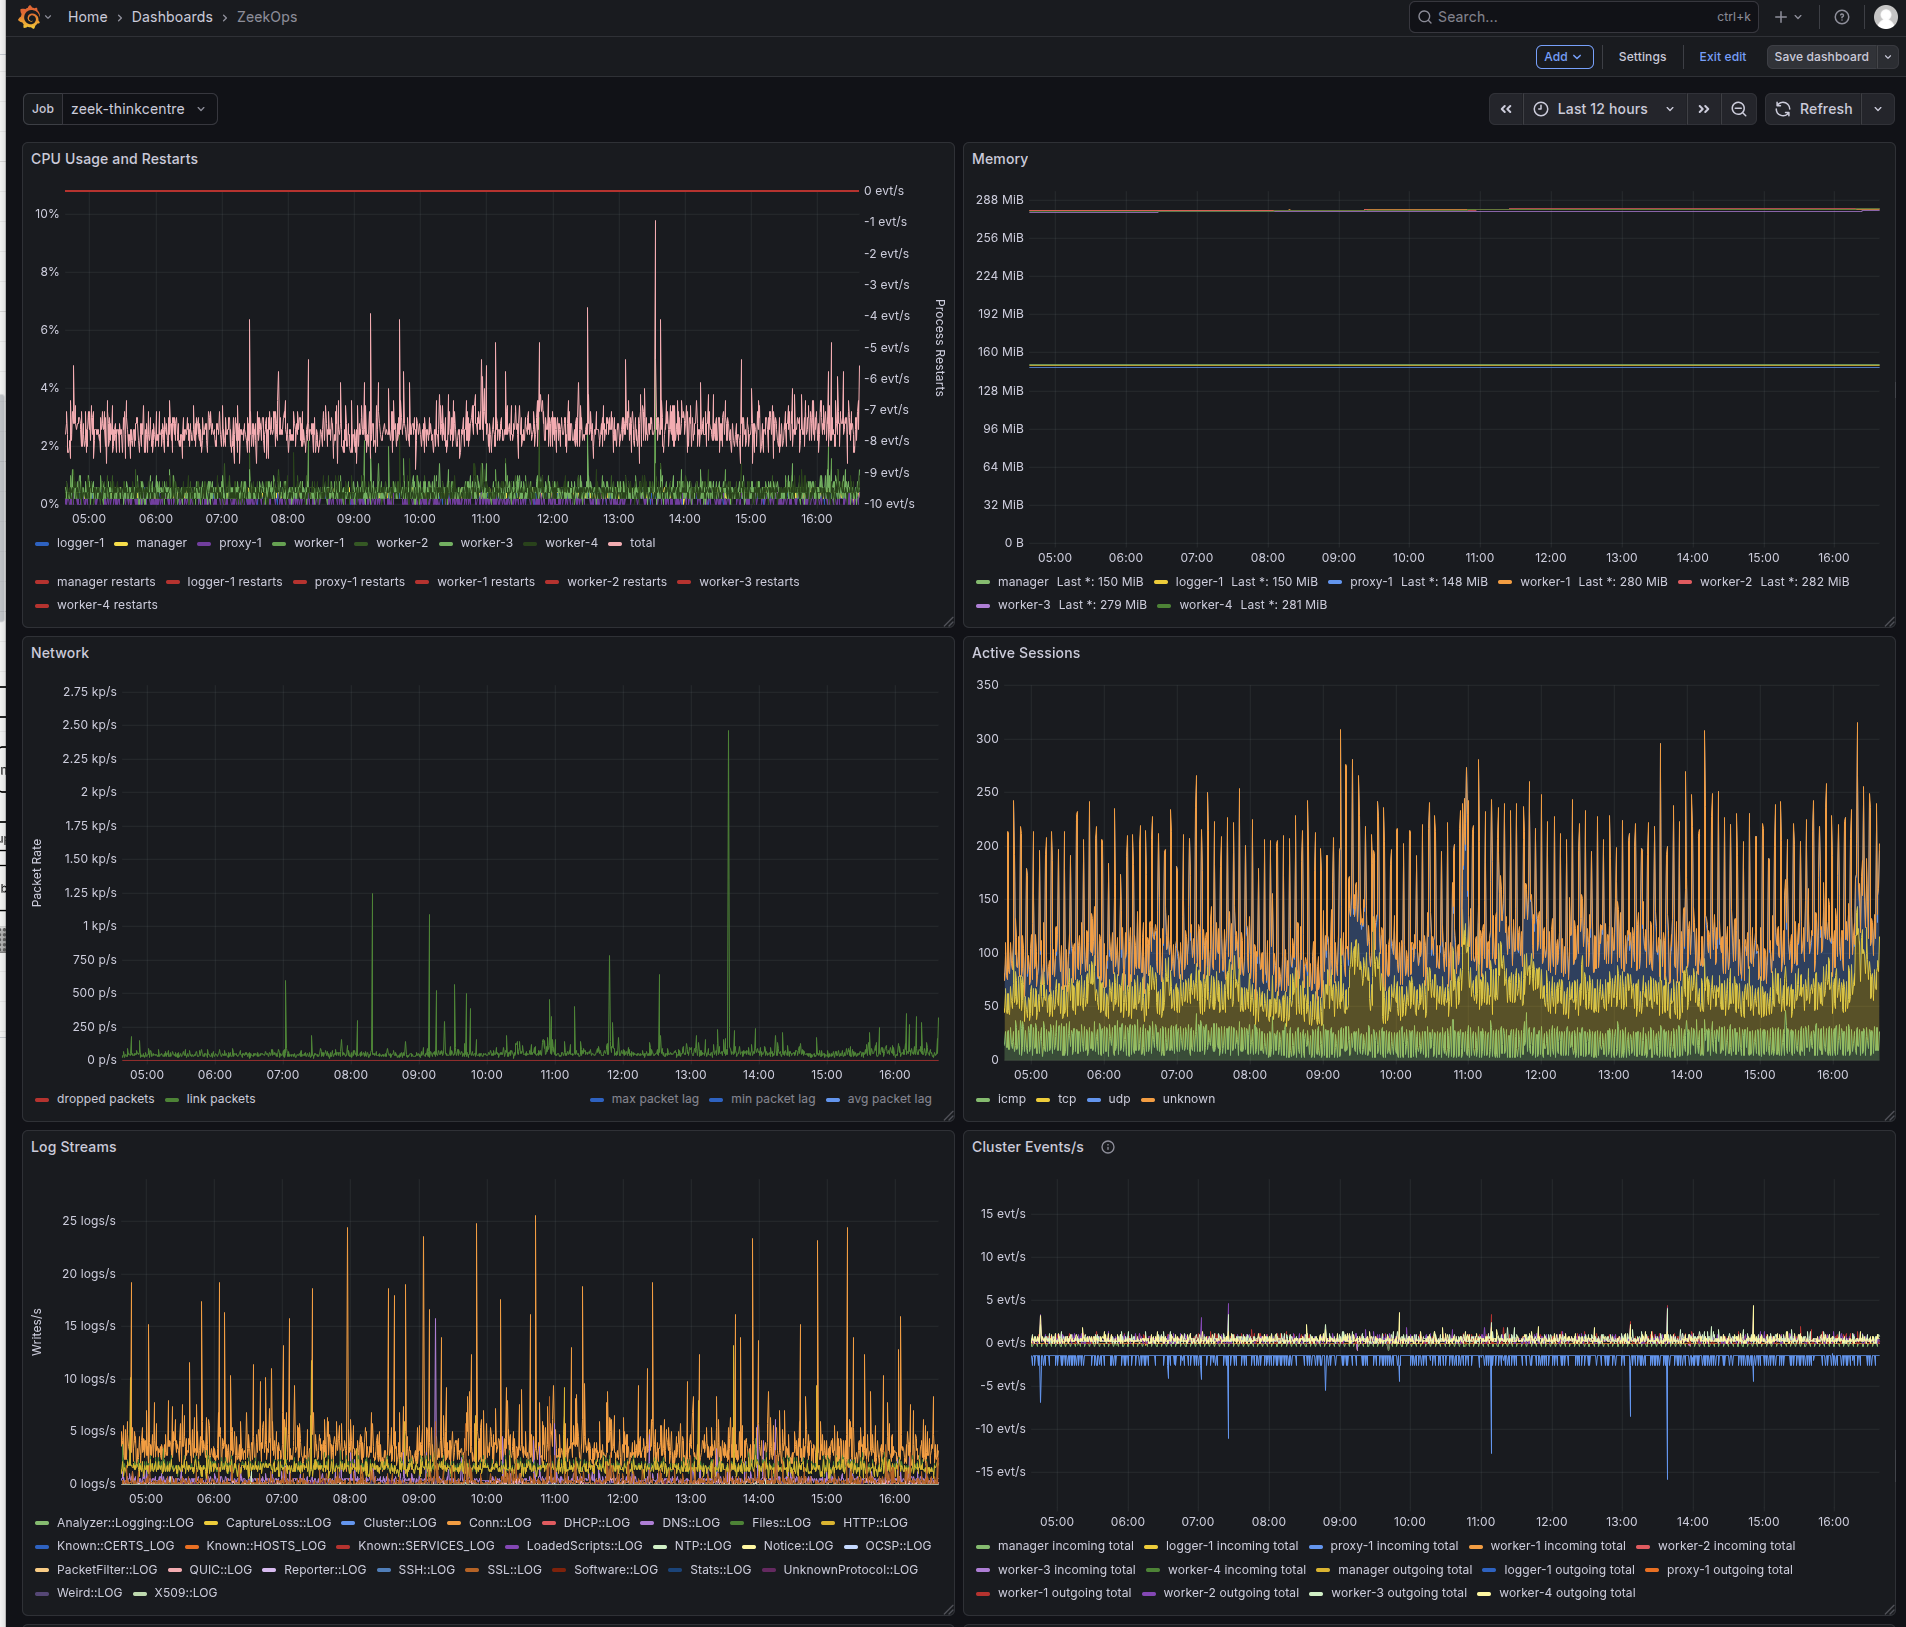
ZeekOps Dashboard
A dashboard for Zeek operators.
Configure prometheus to use HTTP service discovery with Zeek's manager discovery endpoint:
scrape_configs:
  job_name: zeek-local-http-sd
  scrape_interval: 5s
  http_sd_configs:
    - url: http://localhost:9991/services.json
      refresh_interval: 10s
Data source config
Collector type:
Collector plugins:
Collector config:
Revisions
Upload an updated version of an exported dashboard.json file from Grafana
| Revision | Description | Created | |
|---|---|---|---|
| Download |