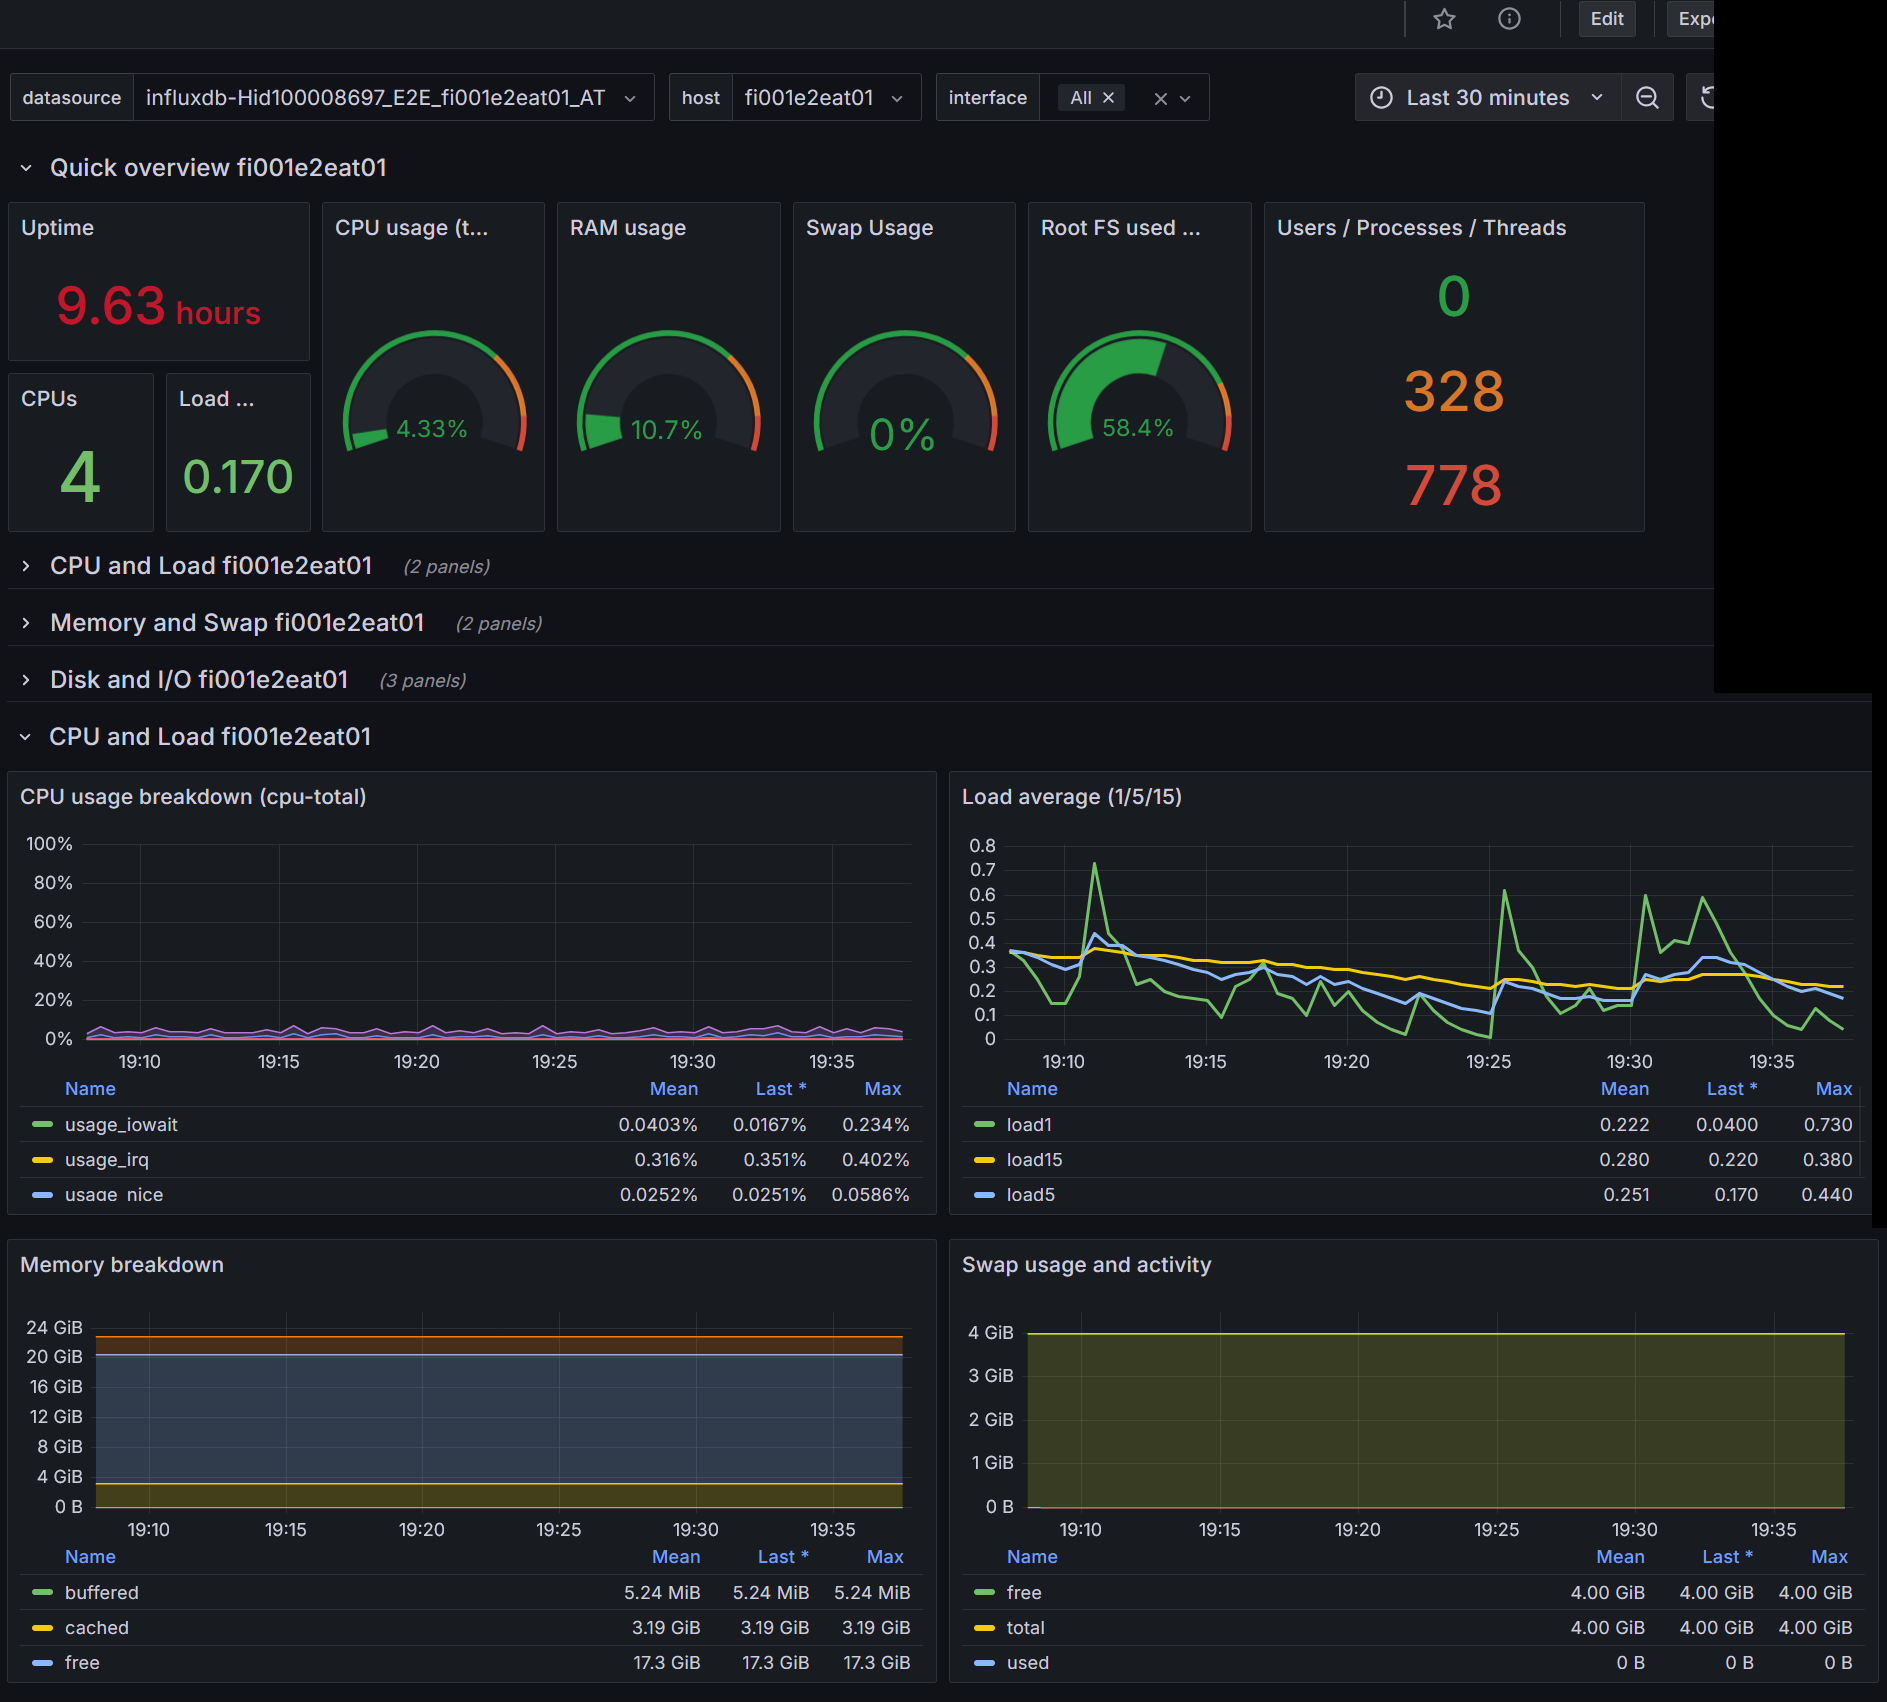
Host metrics
A new panel showing Load5 divided by CPU count has been added to see true system load. Multi‑CPU machines can report high raw Load5 values and trigger alarm. Dividing Load5 by the number of CPUs normalizes the value and reflects real system utilization.
Fully Variable‑Driven (Plug‑and‑Play)
This dashboard is built around Grafana variables, so you can reuse it across any number of hosts or buckets without editing queries. Variables used everywhere:
- ${datasource} == Selects the InfluxDB datasource (Flux)
- ${bucket} == Bucket containing Telegraf metrics
- ${host} == Hostname filter for all panels
- ${interface} == Network interface selector
- ${disk} == Disk device selector
Every Flux query references these variables, ensuring:
- No hard‑coded hostnames
- No manual query editing
- Works instantly after import Just pick your datasource and host from the dropdowns.
Note: Use Telegraf version 1.37 or later. Protocol-level metrics for [[inputs.net]] began deprecation before Telegraf v1.36.0. Users are encouraged to use [[inputs.nstat]], which provides comprehensive kernel SNMP and netstat counters. This dashboard uses nstat metrics.
Data source config
Collector config:
Upload an updated version of an exported dashboard.json file from Grafana
| Revision | Description | Created | |
|---|---|---|---|
| Download |