Qdrant Dashboard (Prometheus metrics only)
Qdrant (Prometheus metrics only) — status, REST/gRPC usage, collections, snapshots, resources (no cAdvisor/node-exporter). Maintained by Divakar R.
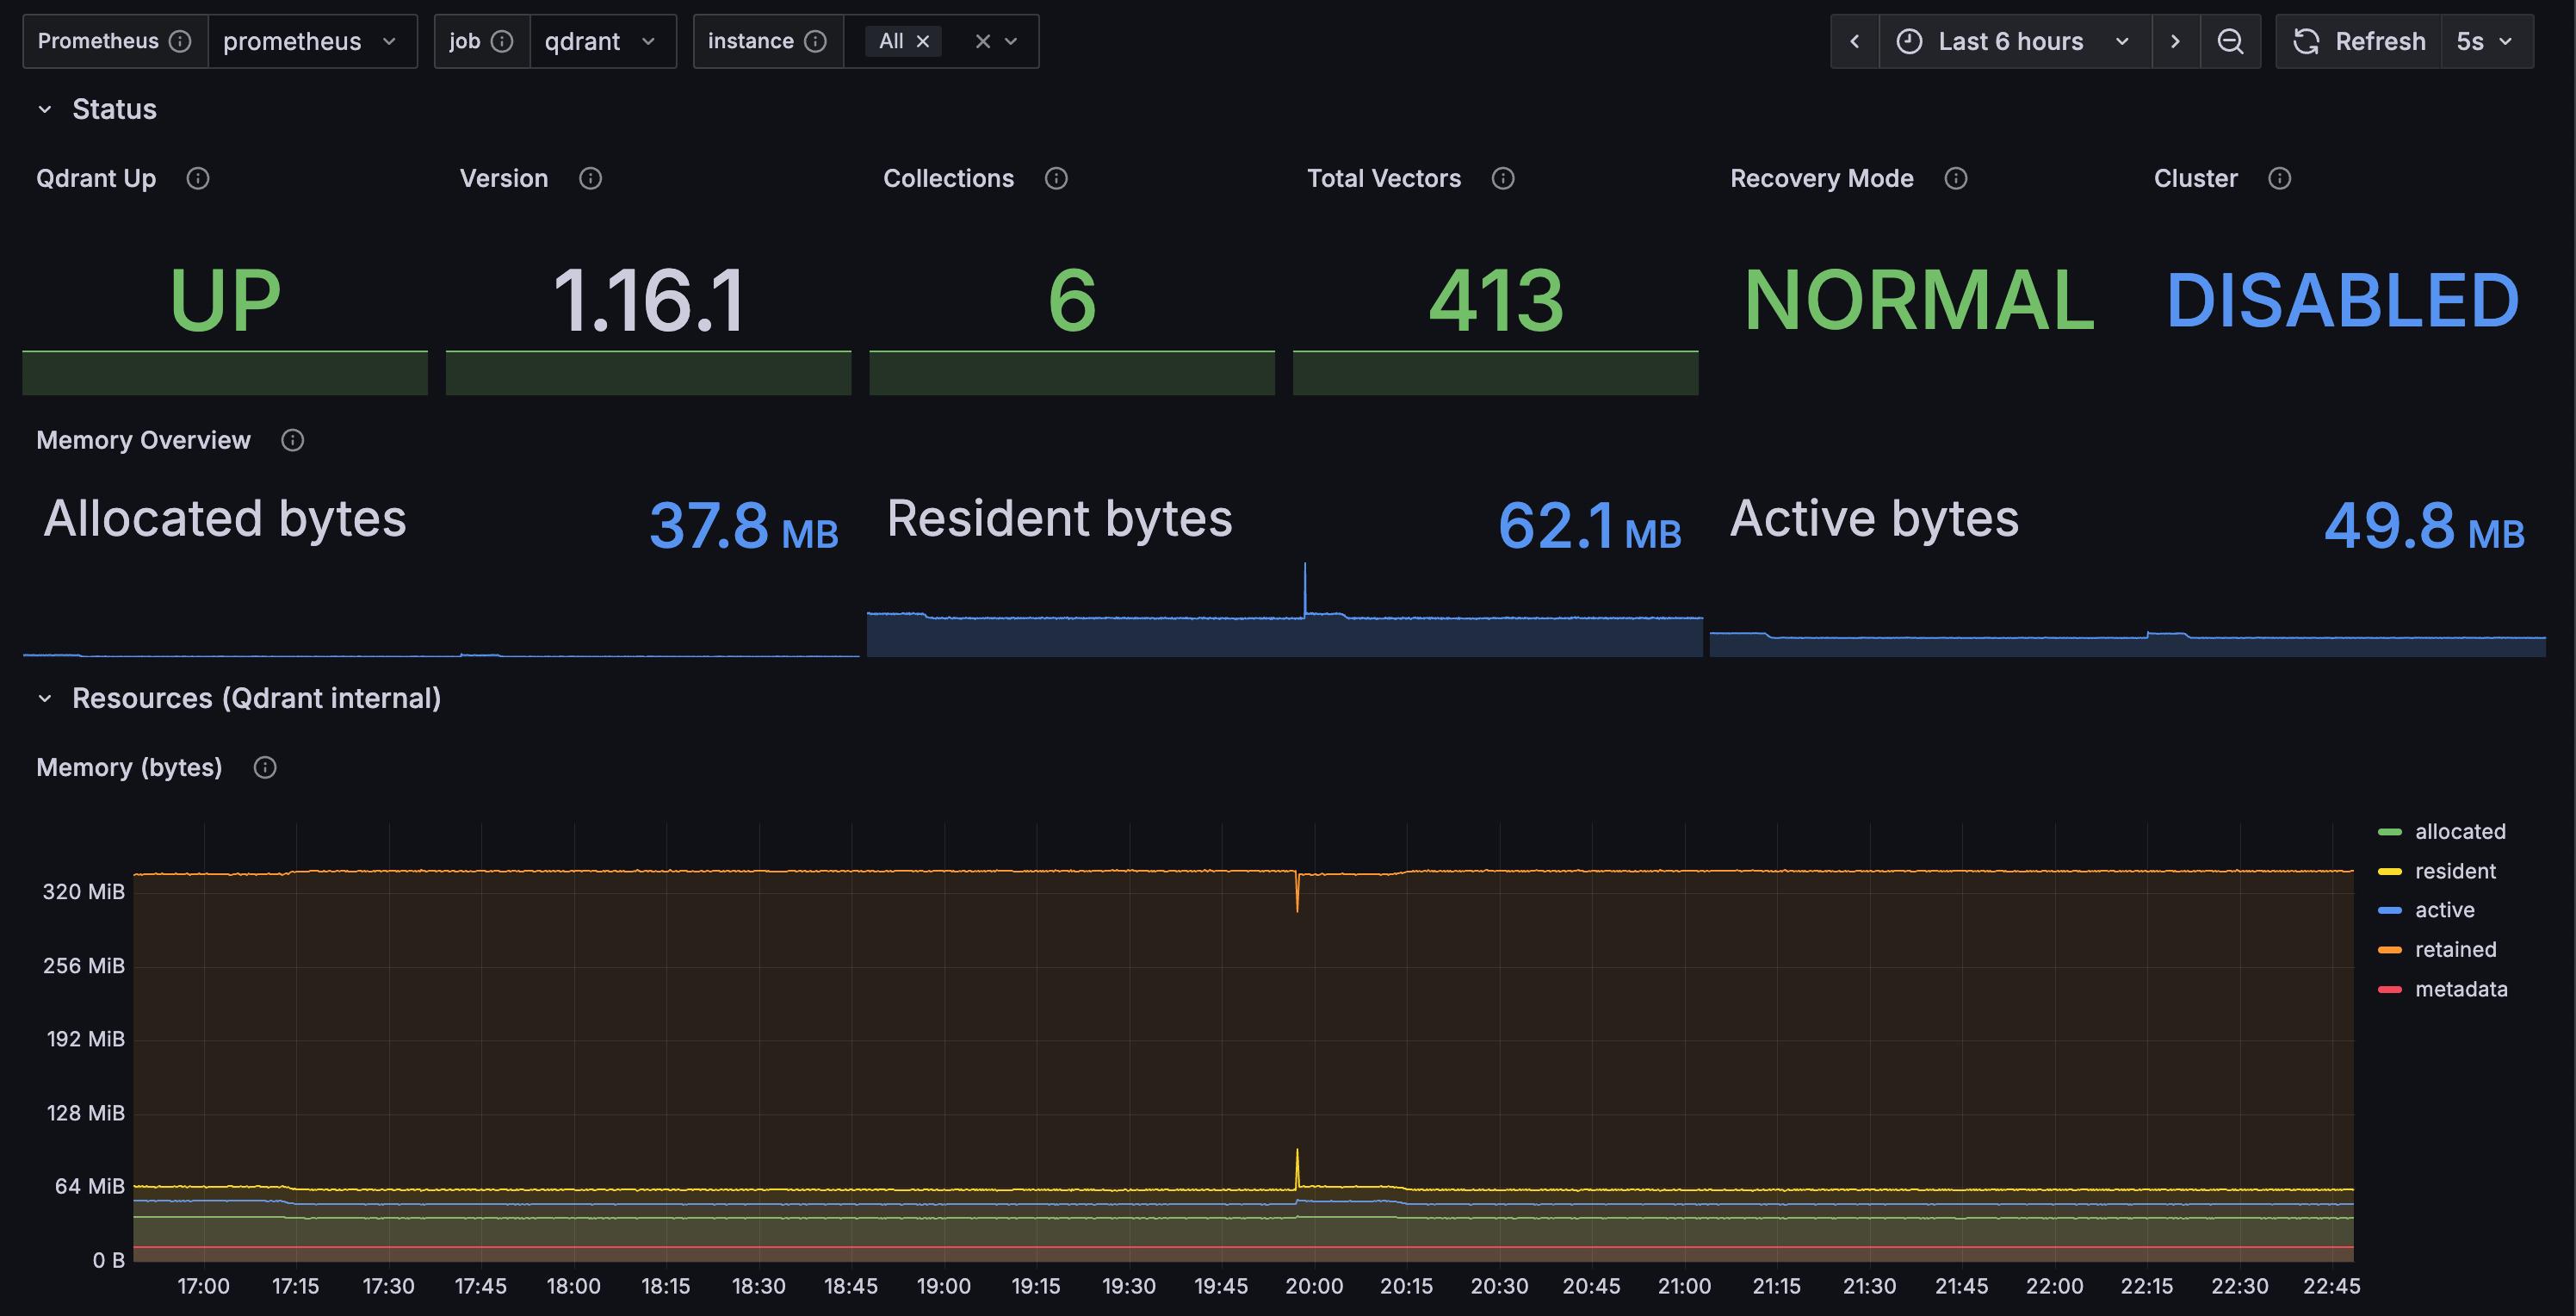
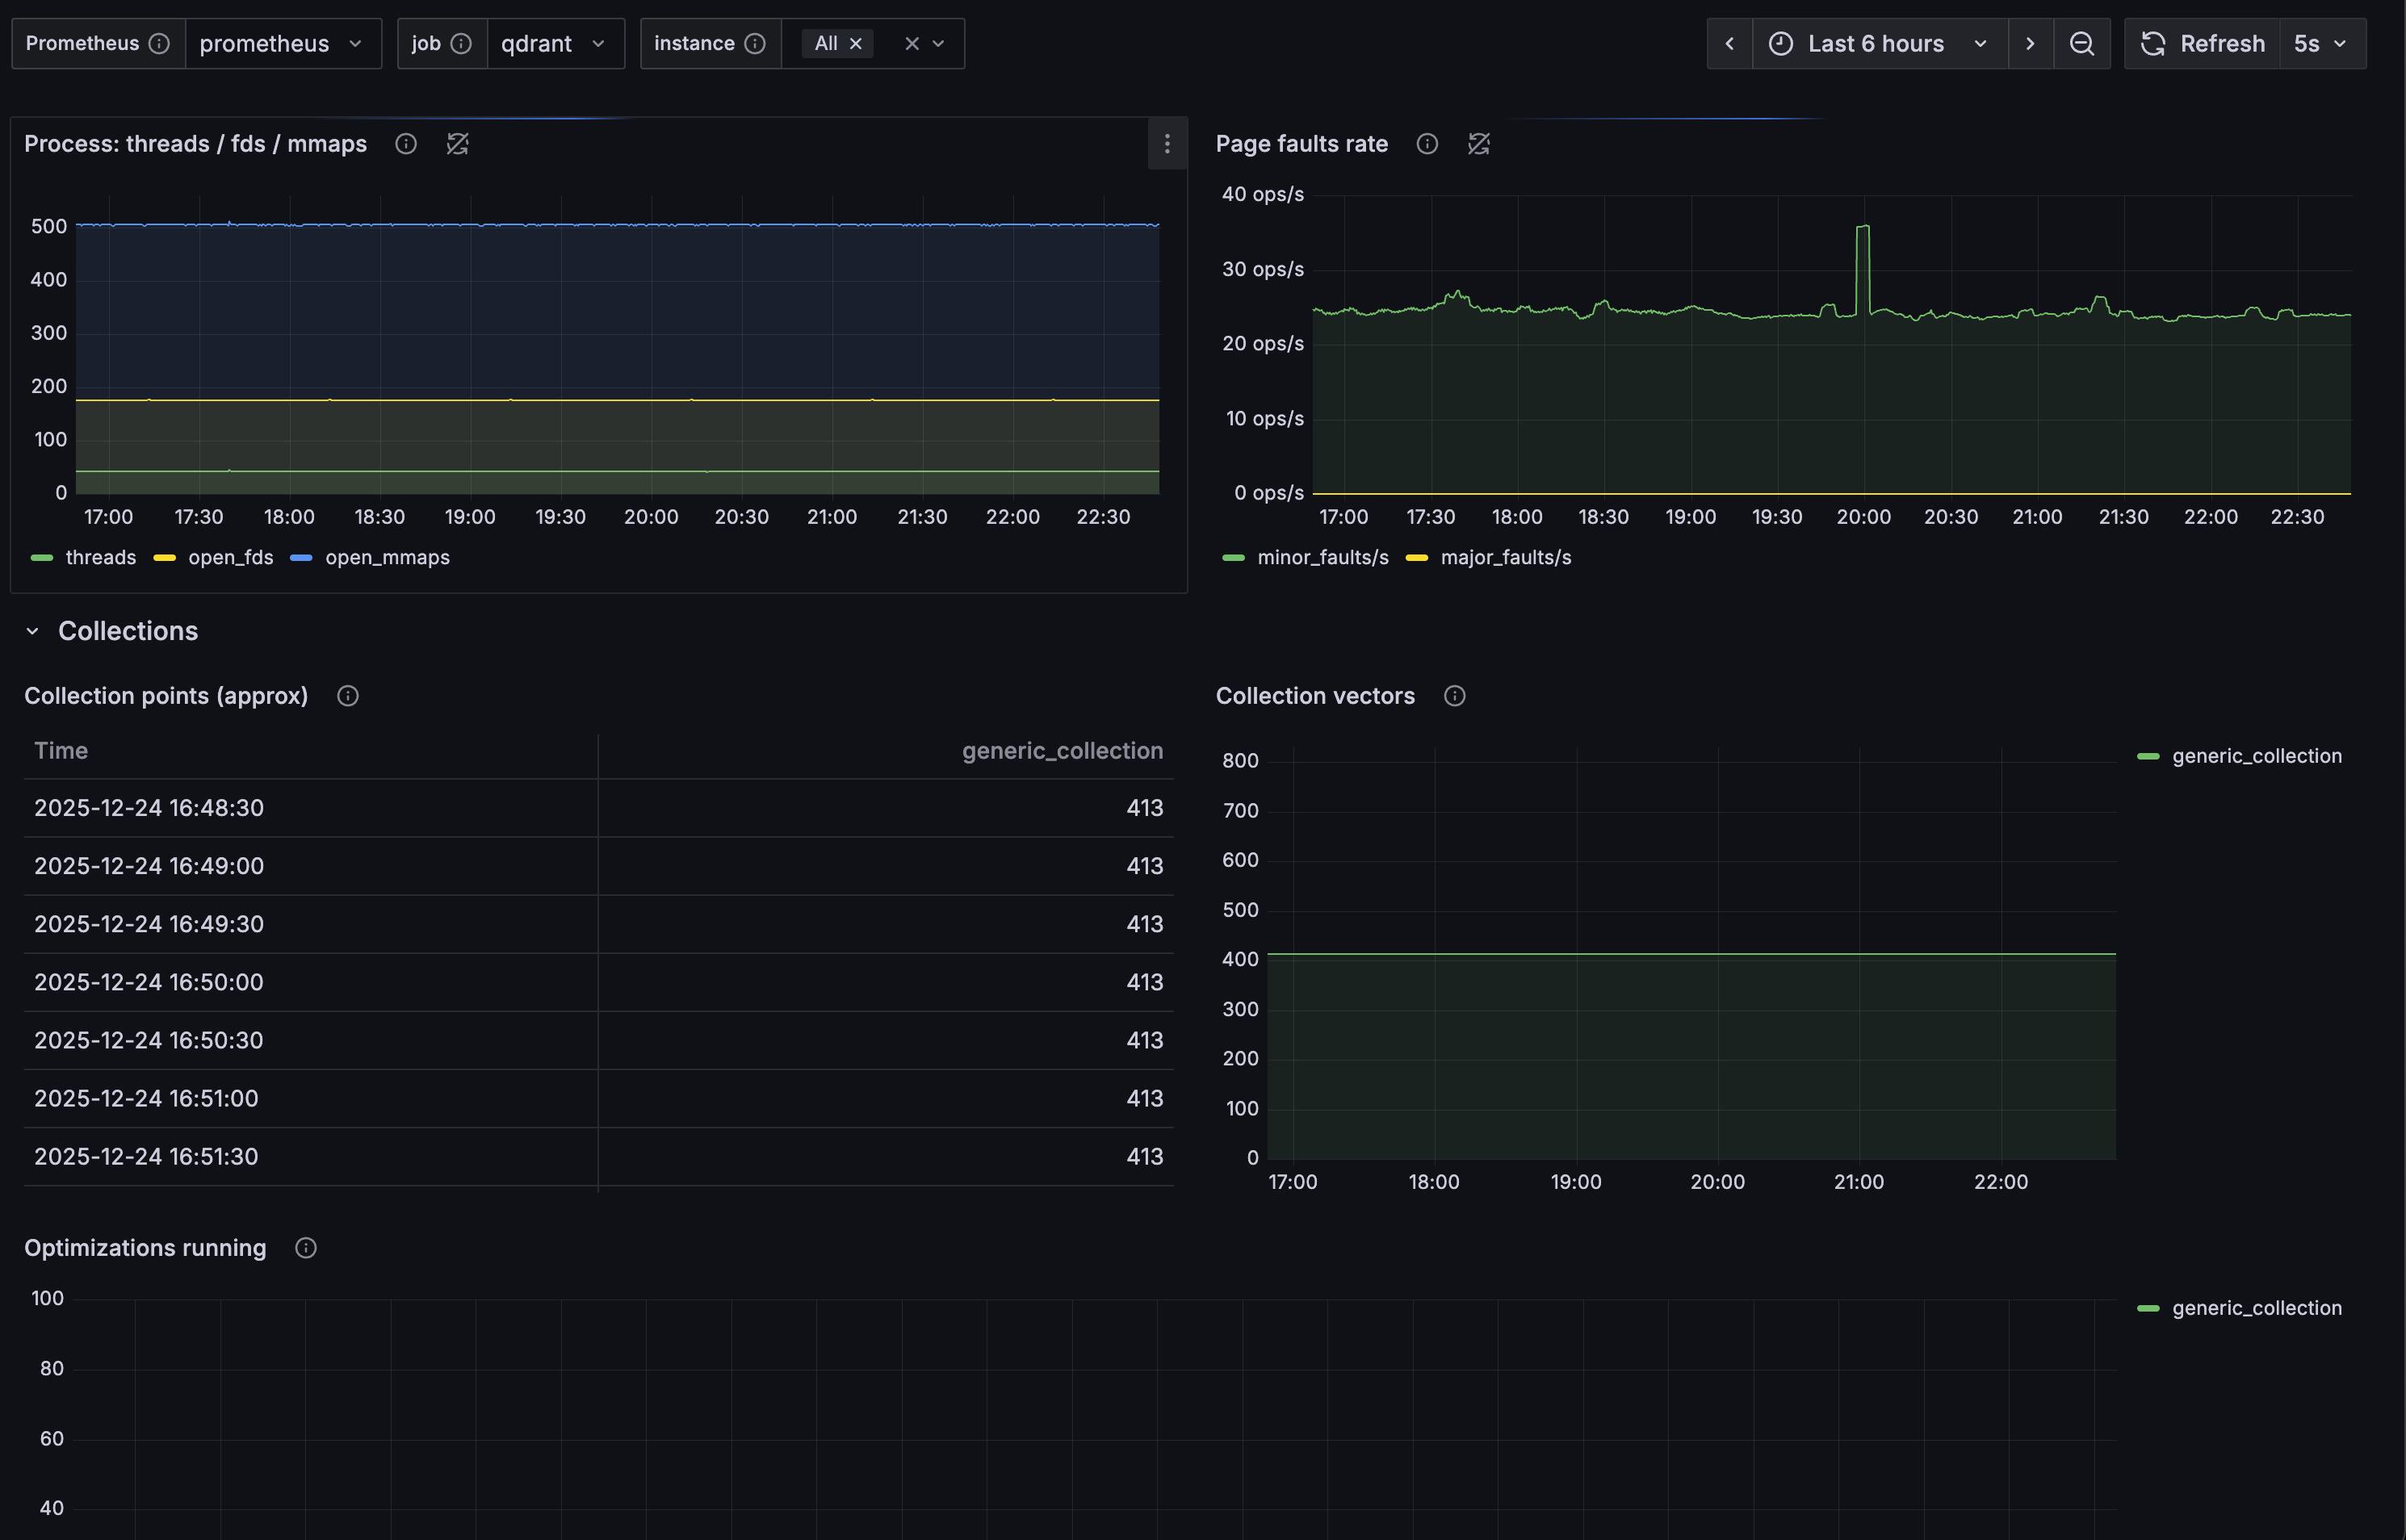
The Qdrant Dashboard (Prometheus metrics only) dashboard uses the prometheus data source to create a Grafana dashboard with the stat, table and timeseries panels.
Data source config
Collector type:
Collector plugins:
Collector config:
Revisions
Upload an updated version of an exported dashboard.json file from Grafana
| Revision | Description | Created | |
|---|---|---|---|
| Download |