VictoriaLogs - Internal State
Quick health overview of VictoriaLogs (+v1.41.0) ingestion and dataset shape: total logs, newest log age, ingestion rate, and the top fields/streams driving volume and storage.
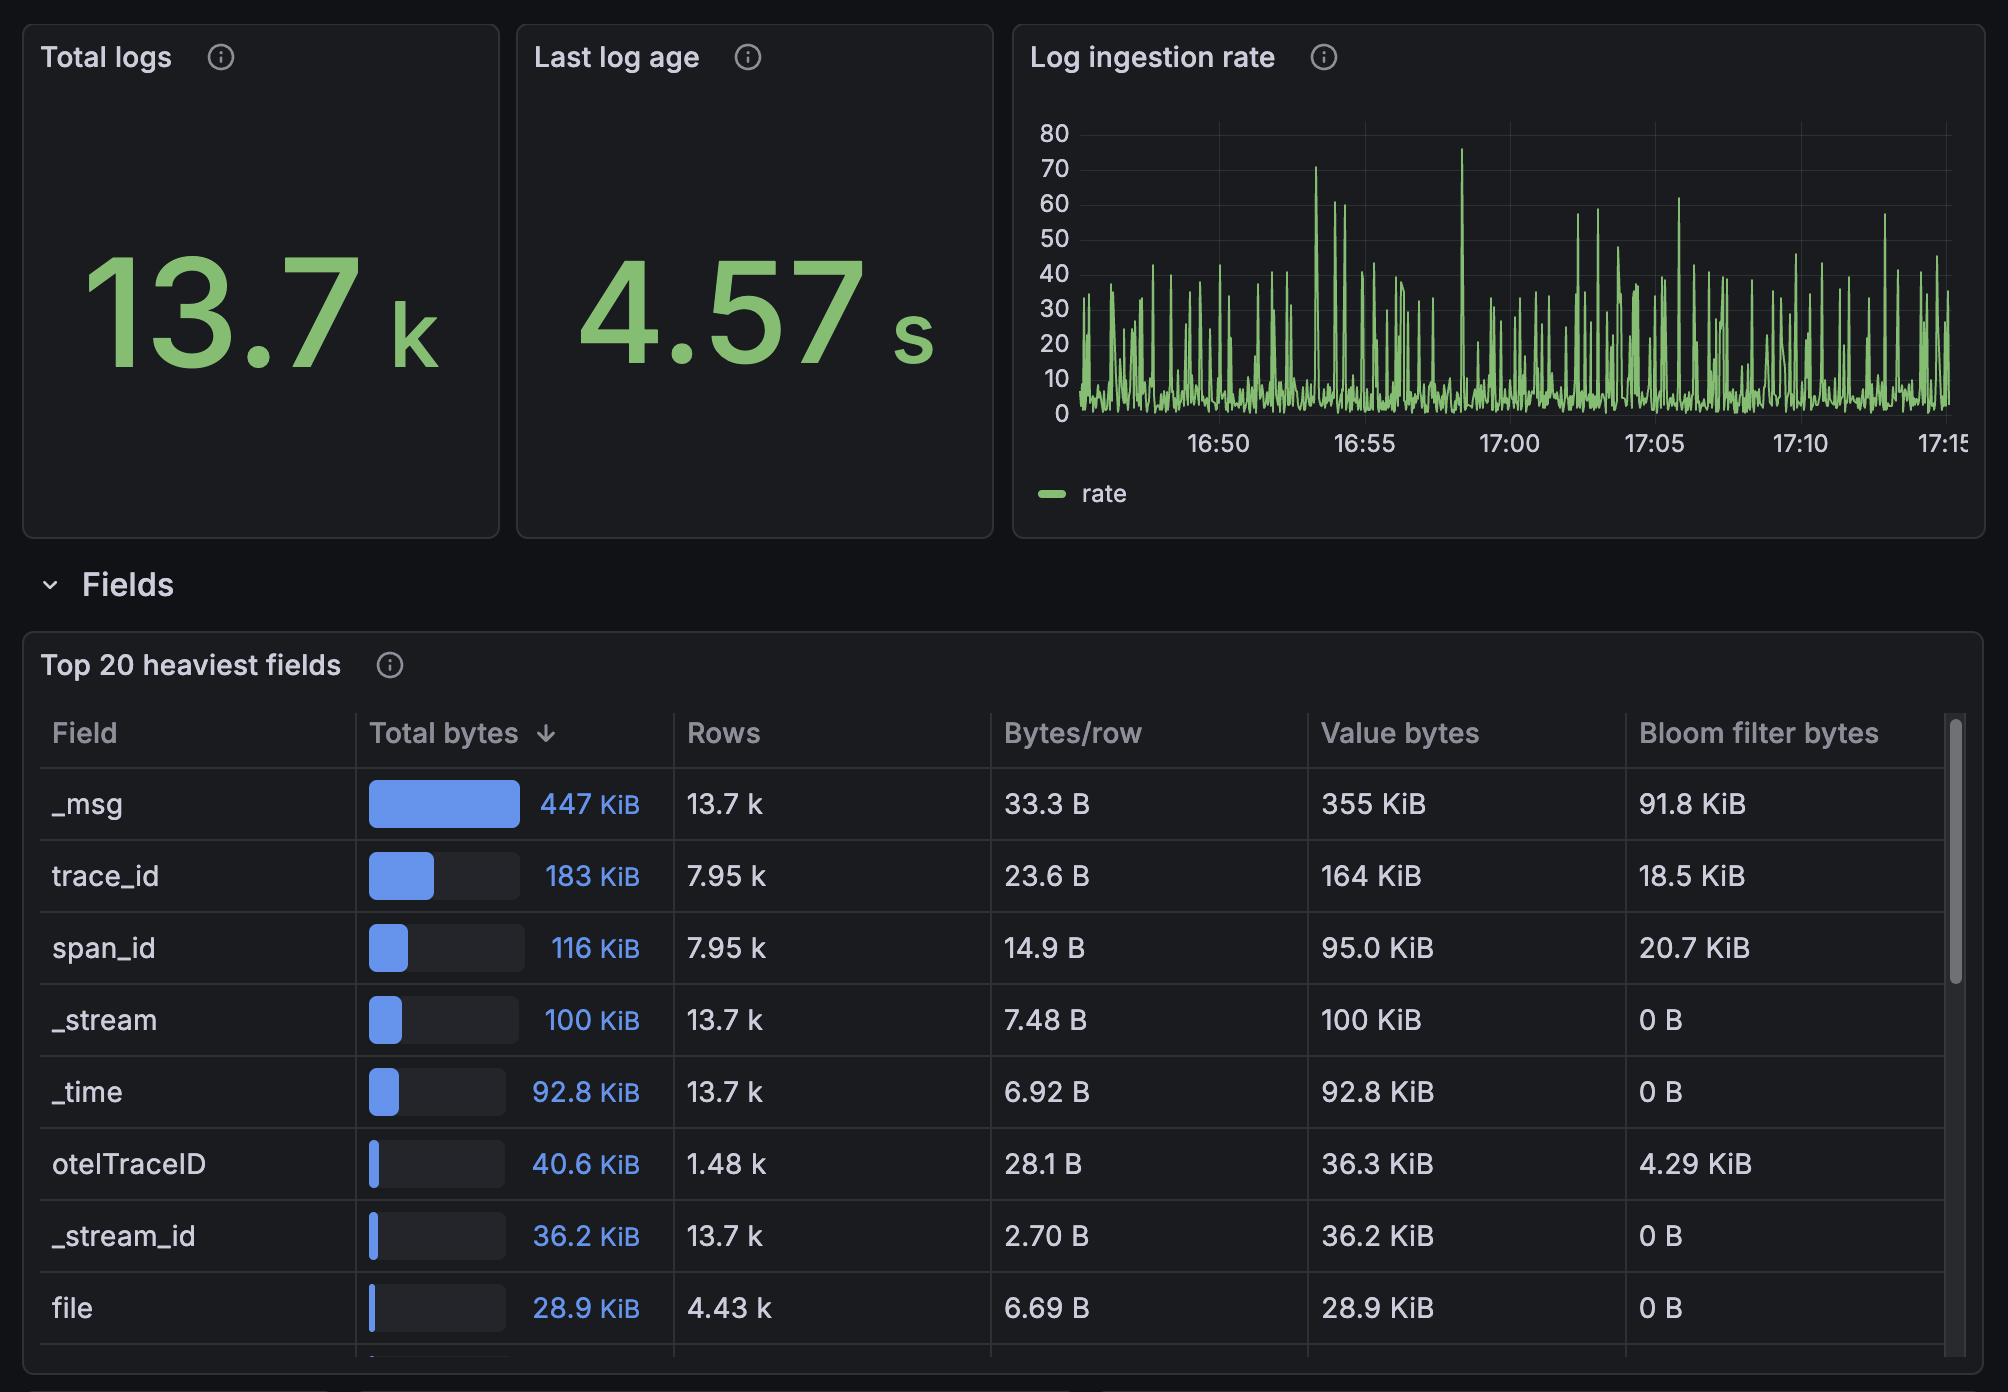
This dashboard helps validate that logs are flowing and quickly answers “what’s dominating my logs right now?” for the selected time range.
It includes:
- General: total matching logs, newest log age (pipeline delay/backpressure signal), and ingestion rate over time.
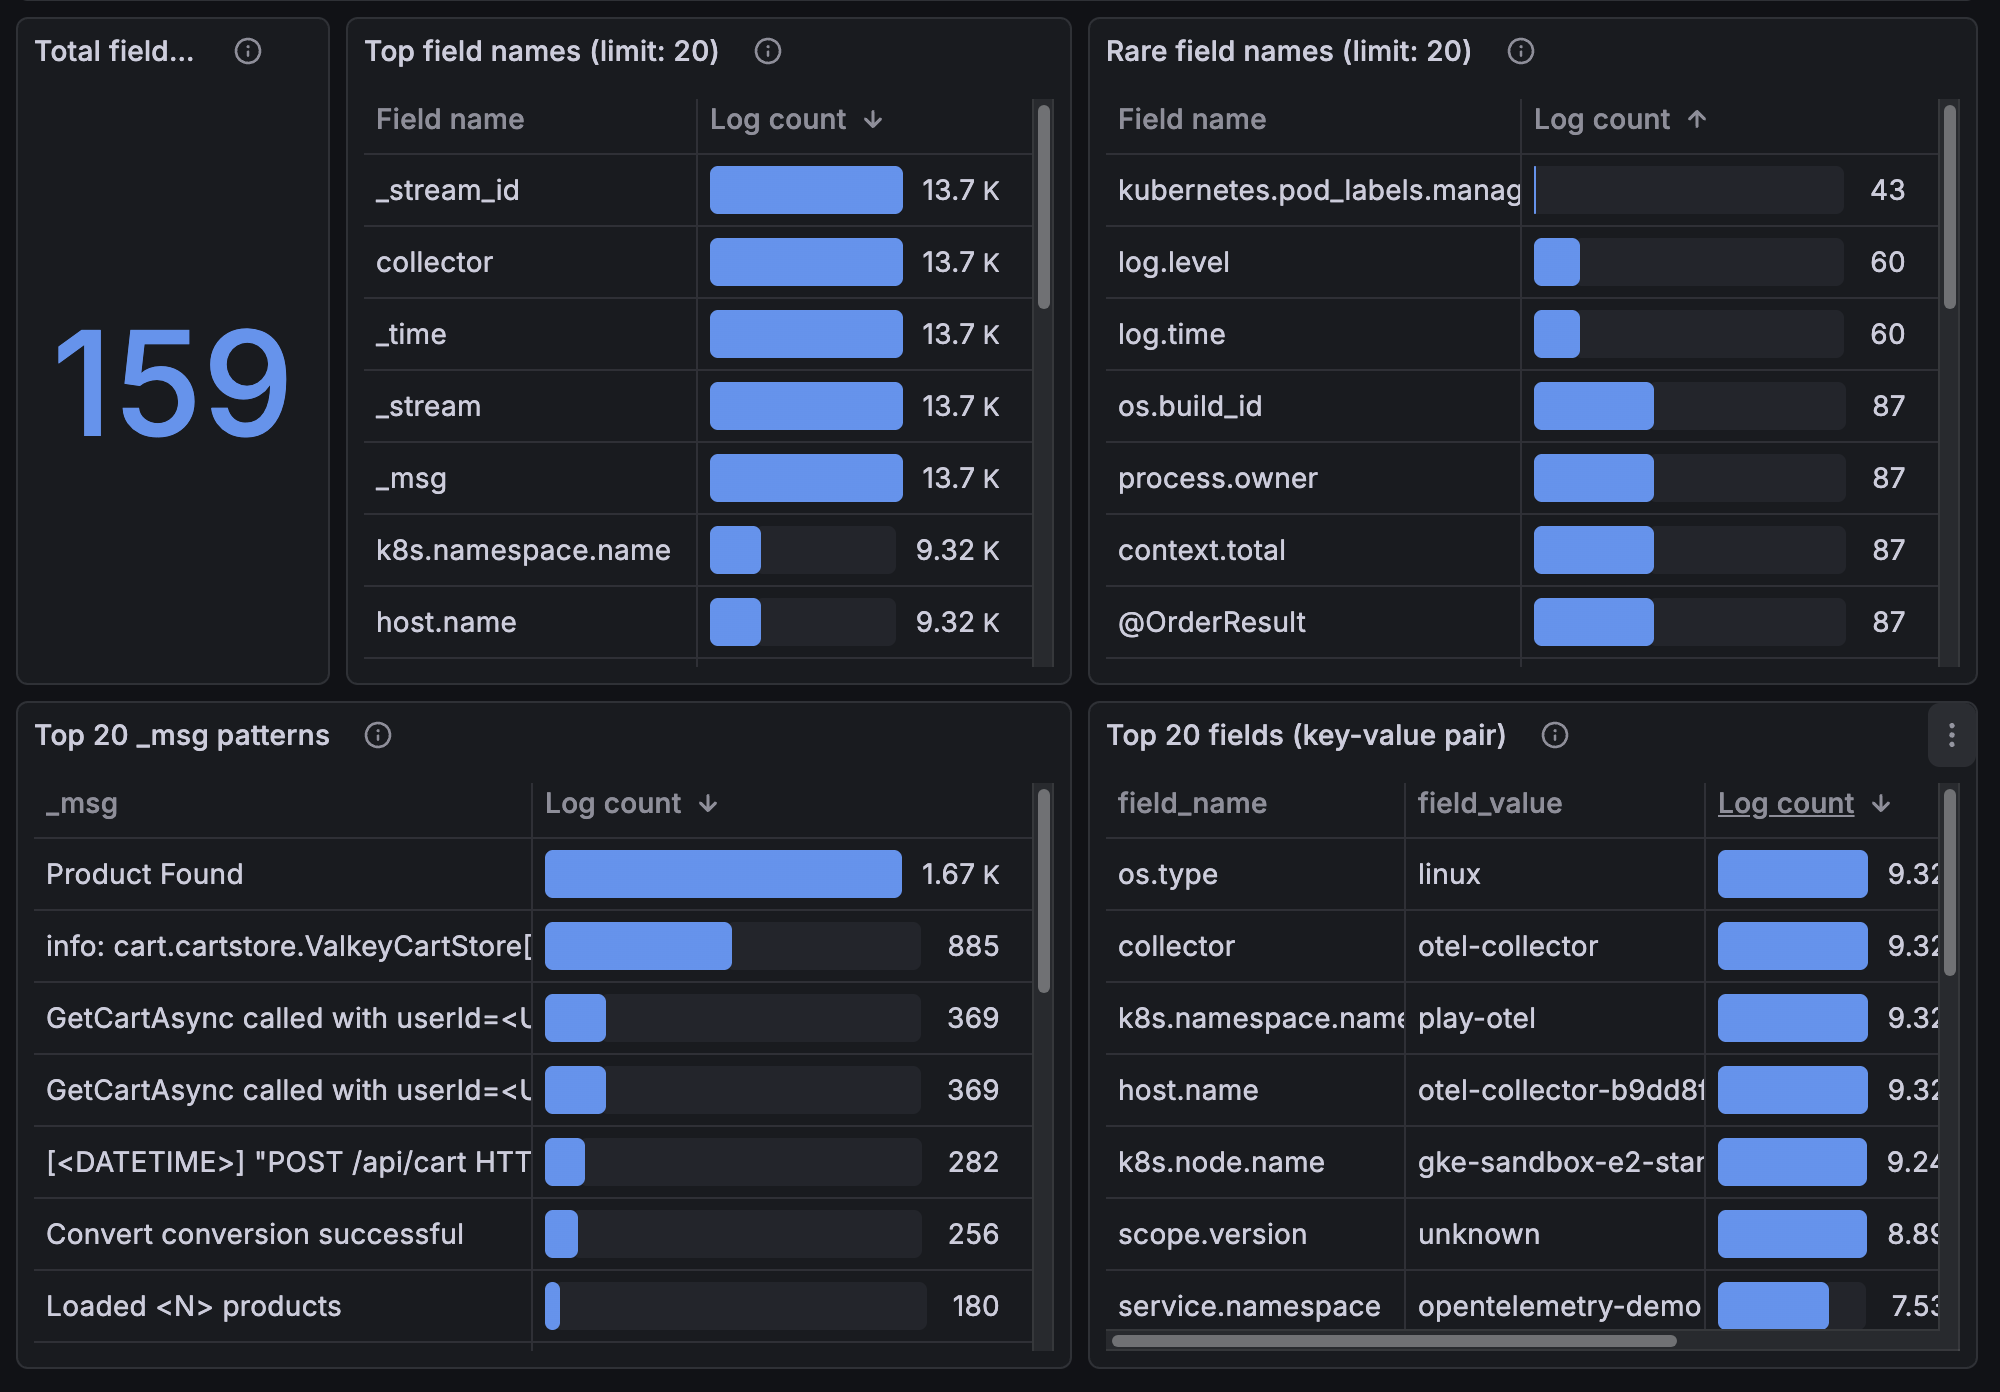
- Fields: storage-heavy fields (bytes/row), total distinct field names, most common and rare field names (schema discovery + typo/dynamic-key detection), top
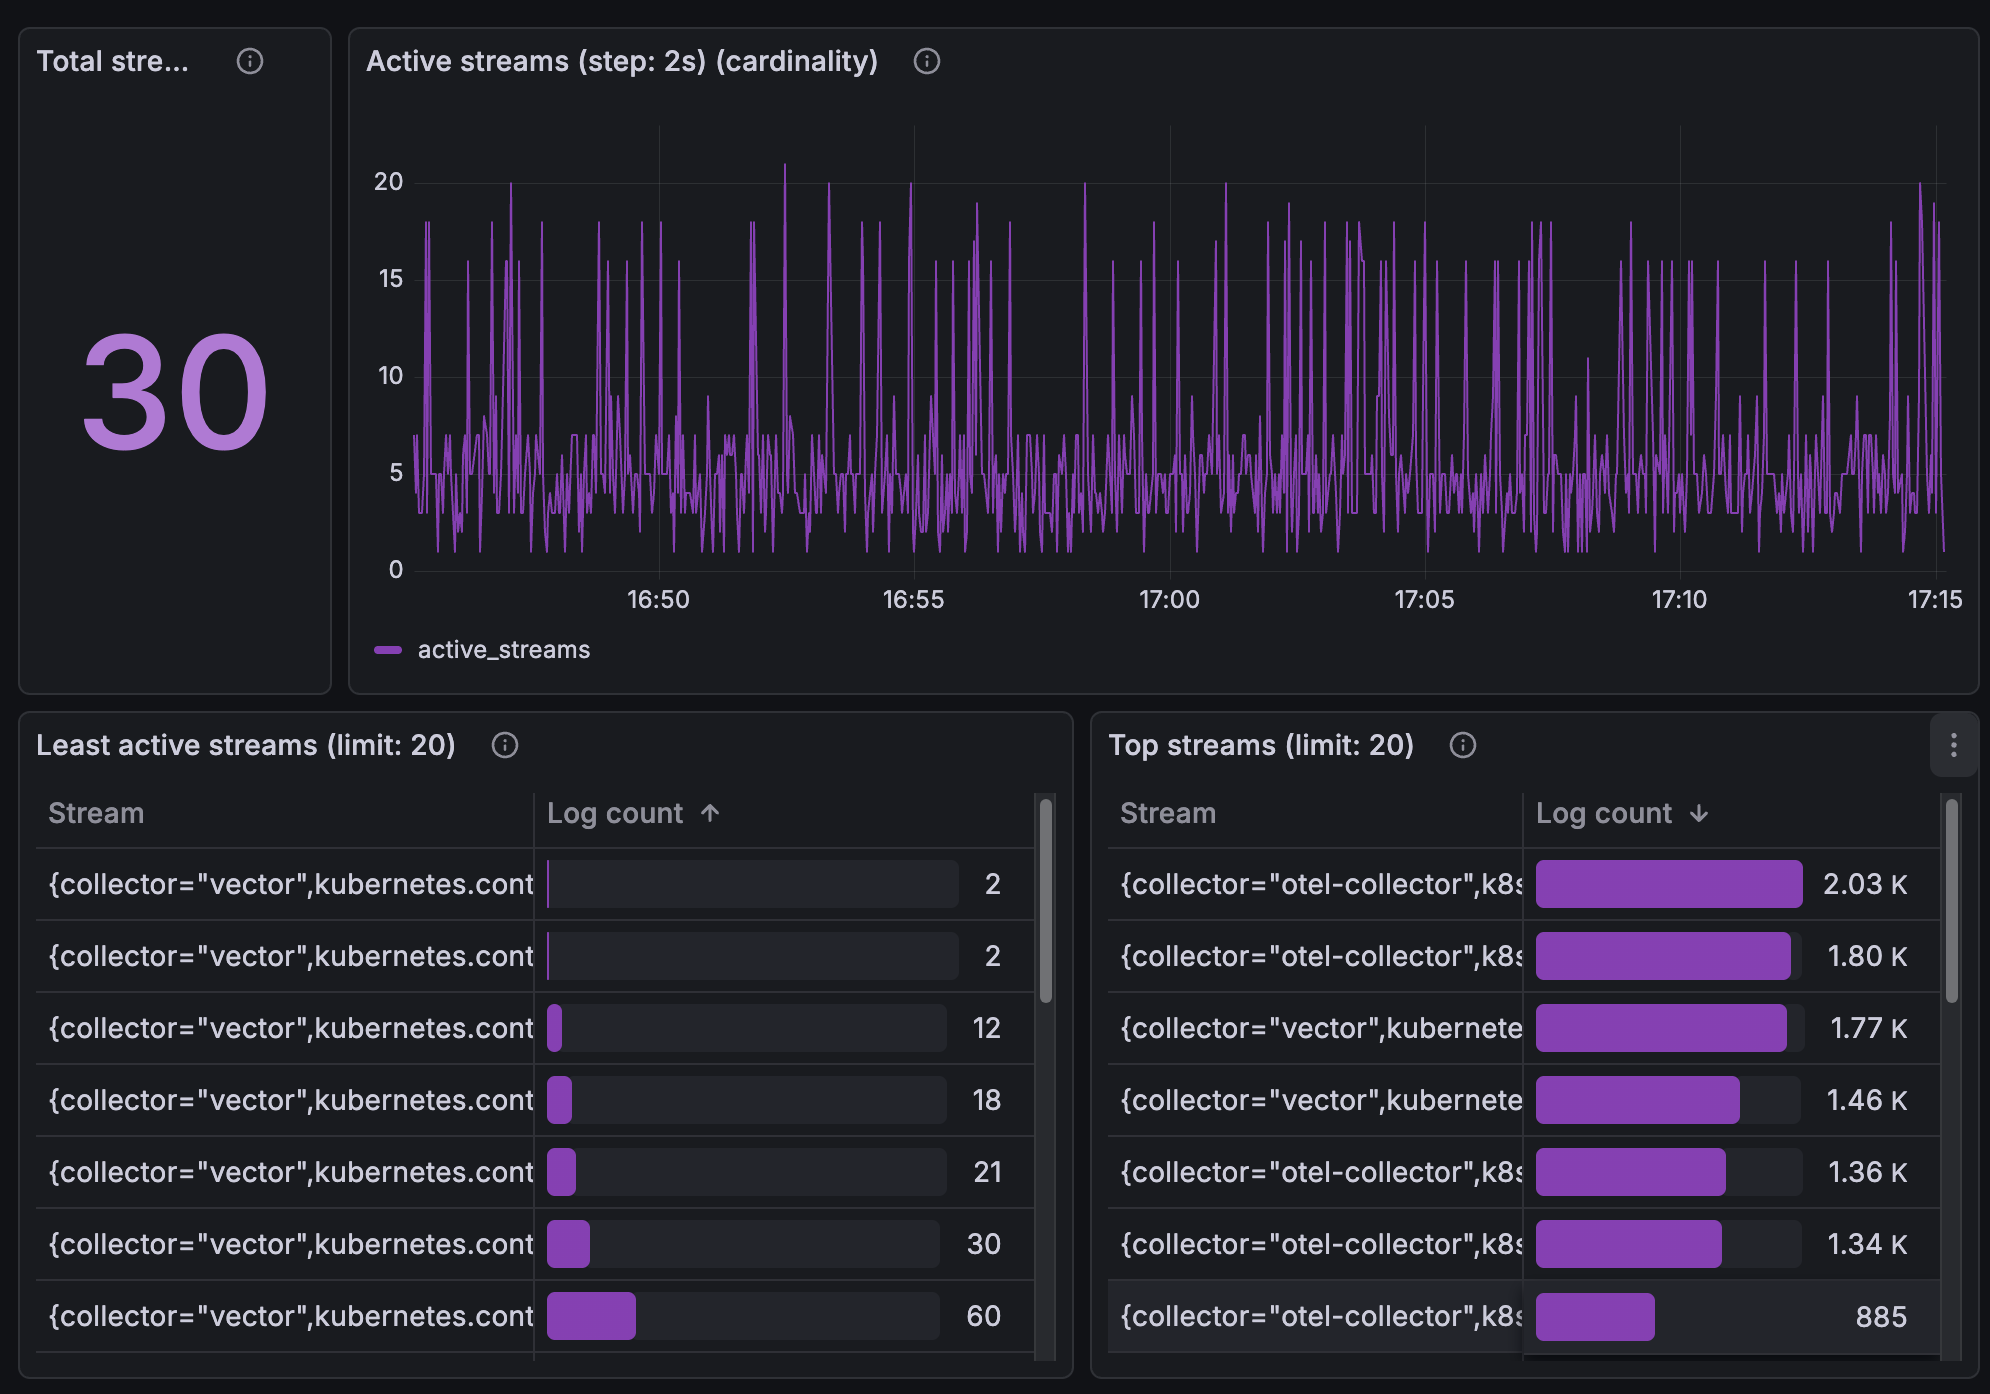
_msgpatterns, and top key=value facets (excluding stream metadata). - Streams: total distinct streams and their cardinality trend, least/most active streams, and streams ranked by storage size (hits/bytes).
- Raw logs: recent log sample for drill-down and quick spot checks.
Data source config
Collector type:
Collector plugins:
Collector config:
Revisions
Upload an updated version of an exported dashboard.json file from Grafana
| Revision | Description | Created | |
|---|---|---|---|
| Download |