Tor Relay Stats Monitor
Comprehensive monitoring dashboard for Tor relay metrics including traffic, connections, circuits, and performance indicators
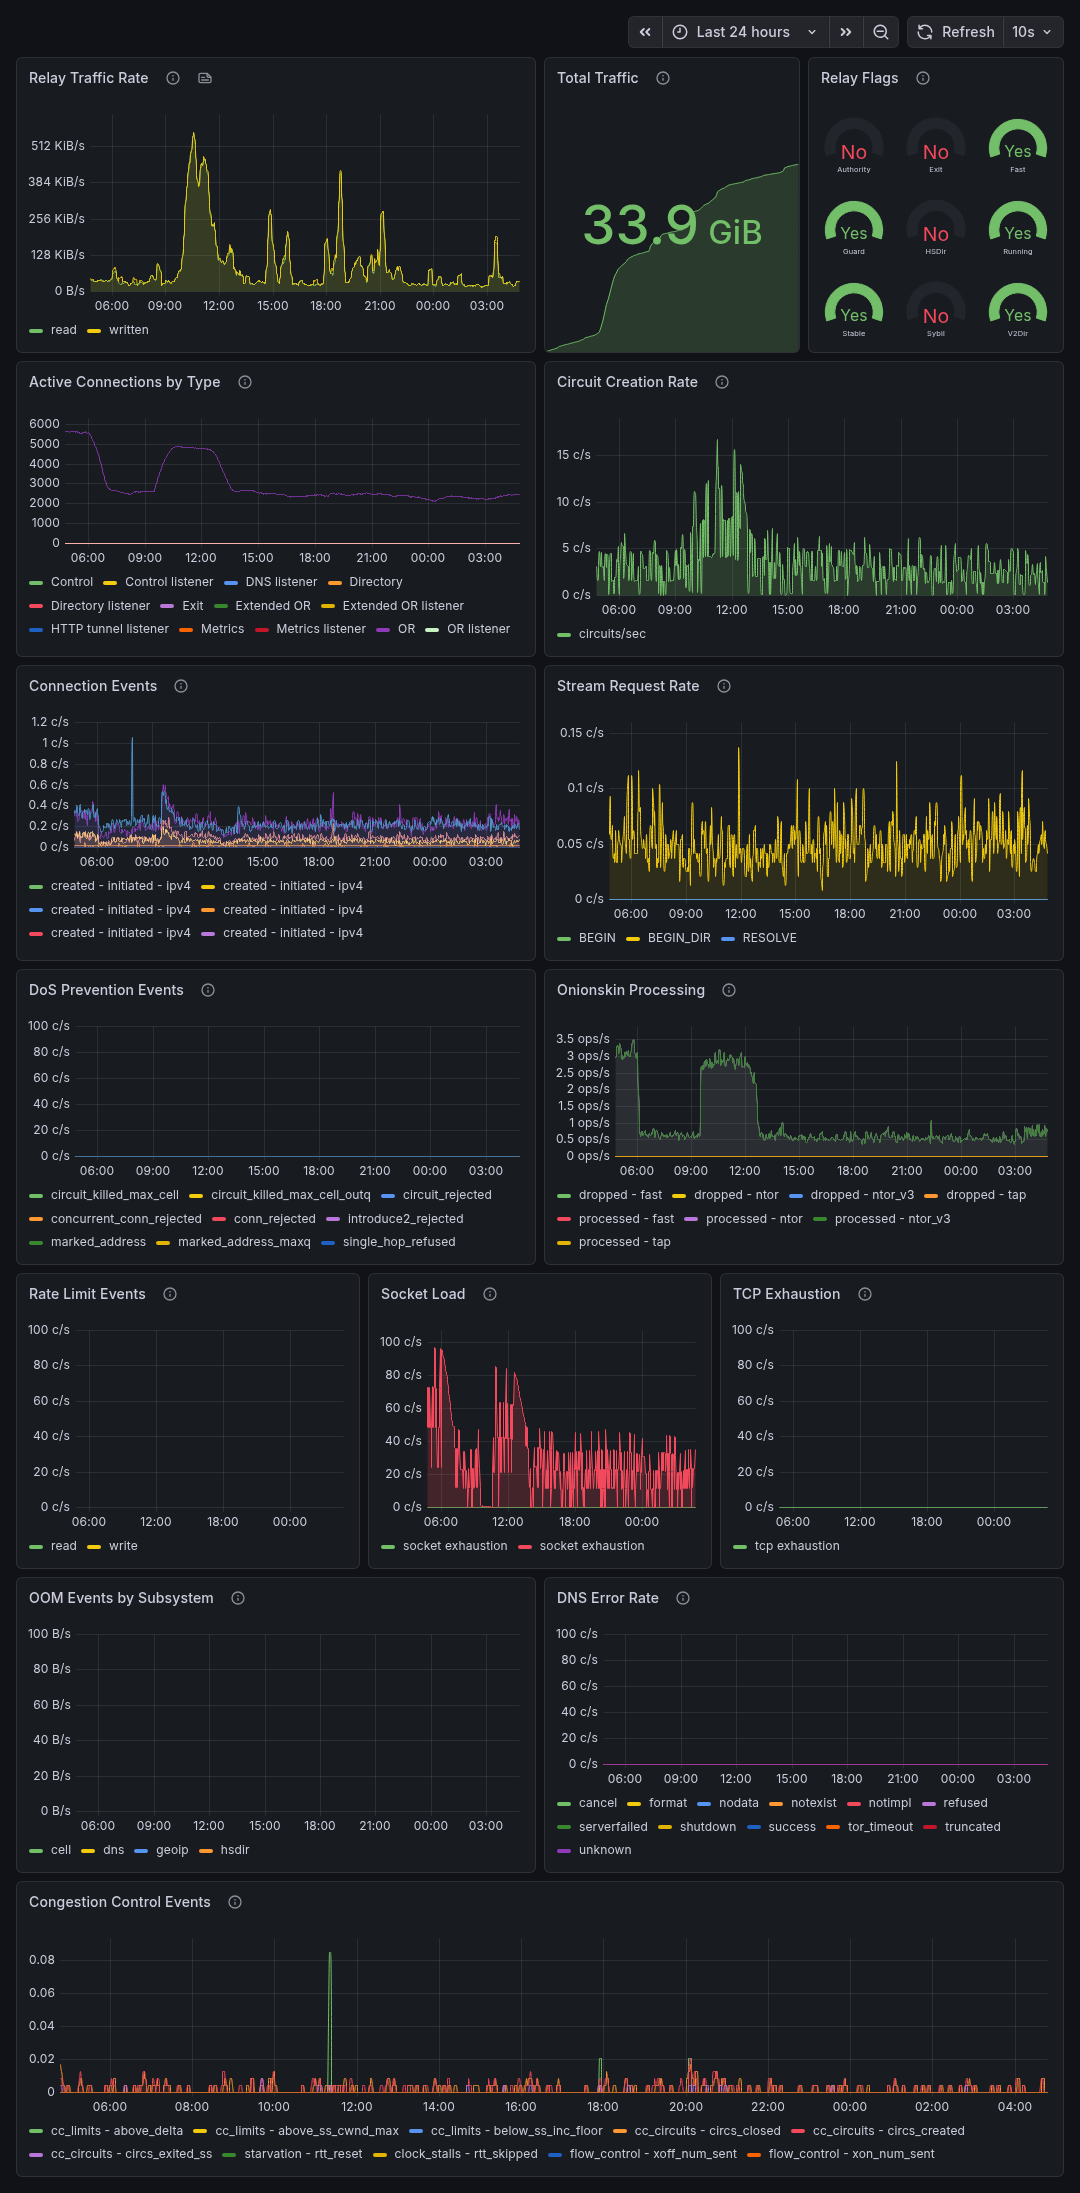
The Tor Relay Stats Monitor dashboard uses the prometheus data source to create a Grafana dashboard with the gauge, stat and timeseries panels.
Data source config
Collector type:
Collector plugins:
Collector config:
Revisions
Upload an updated version of an exported dashboard.json file from Grafana
| Revision | Description | Created | |
|---|---|---|---|
| Download |