Technitium DNS Exporter
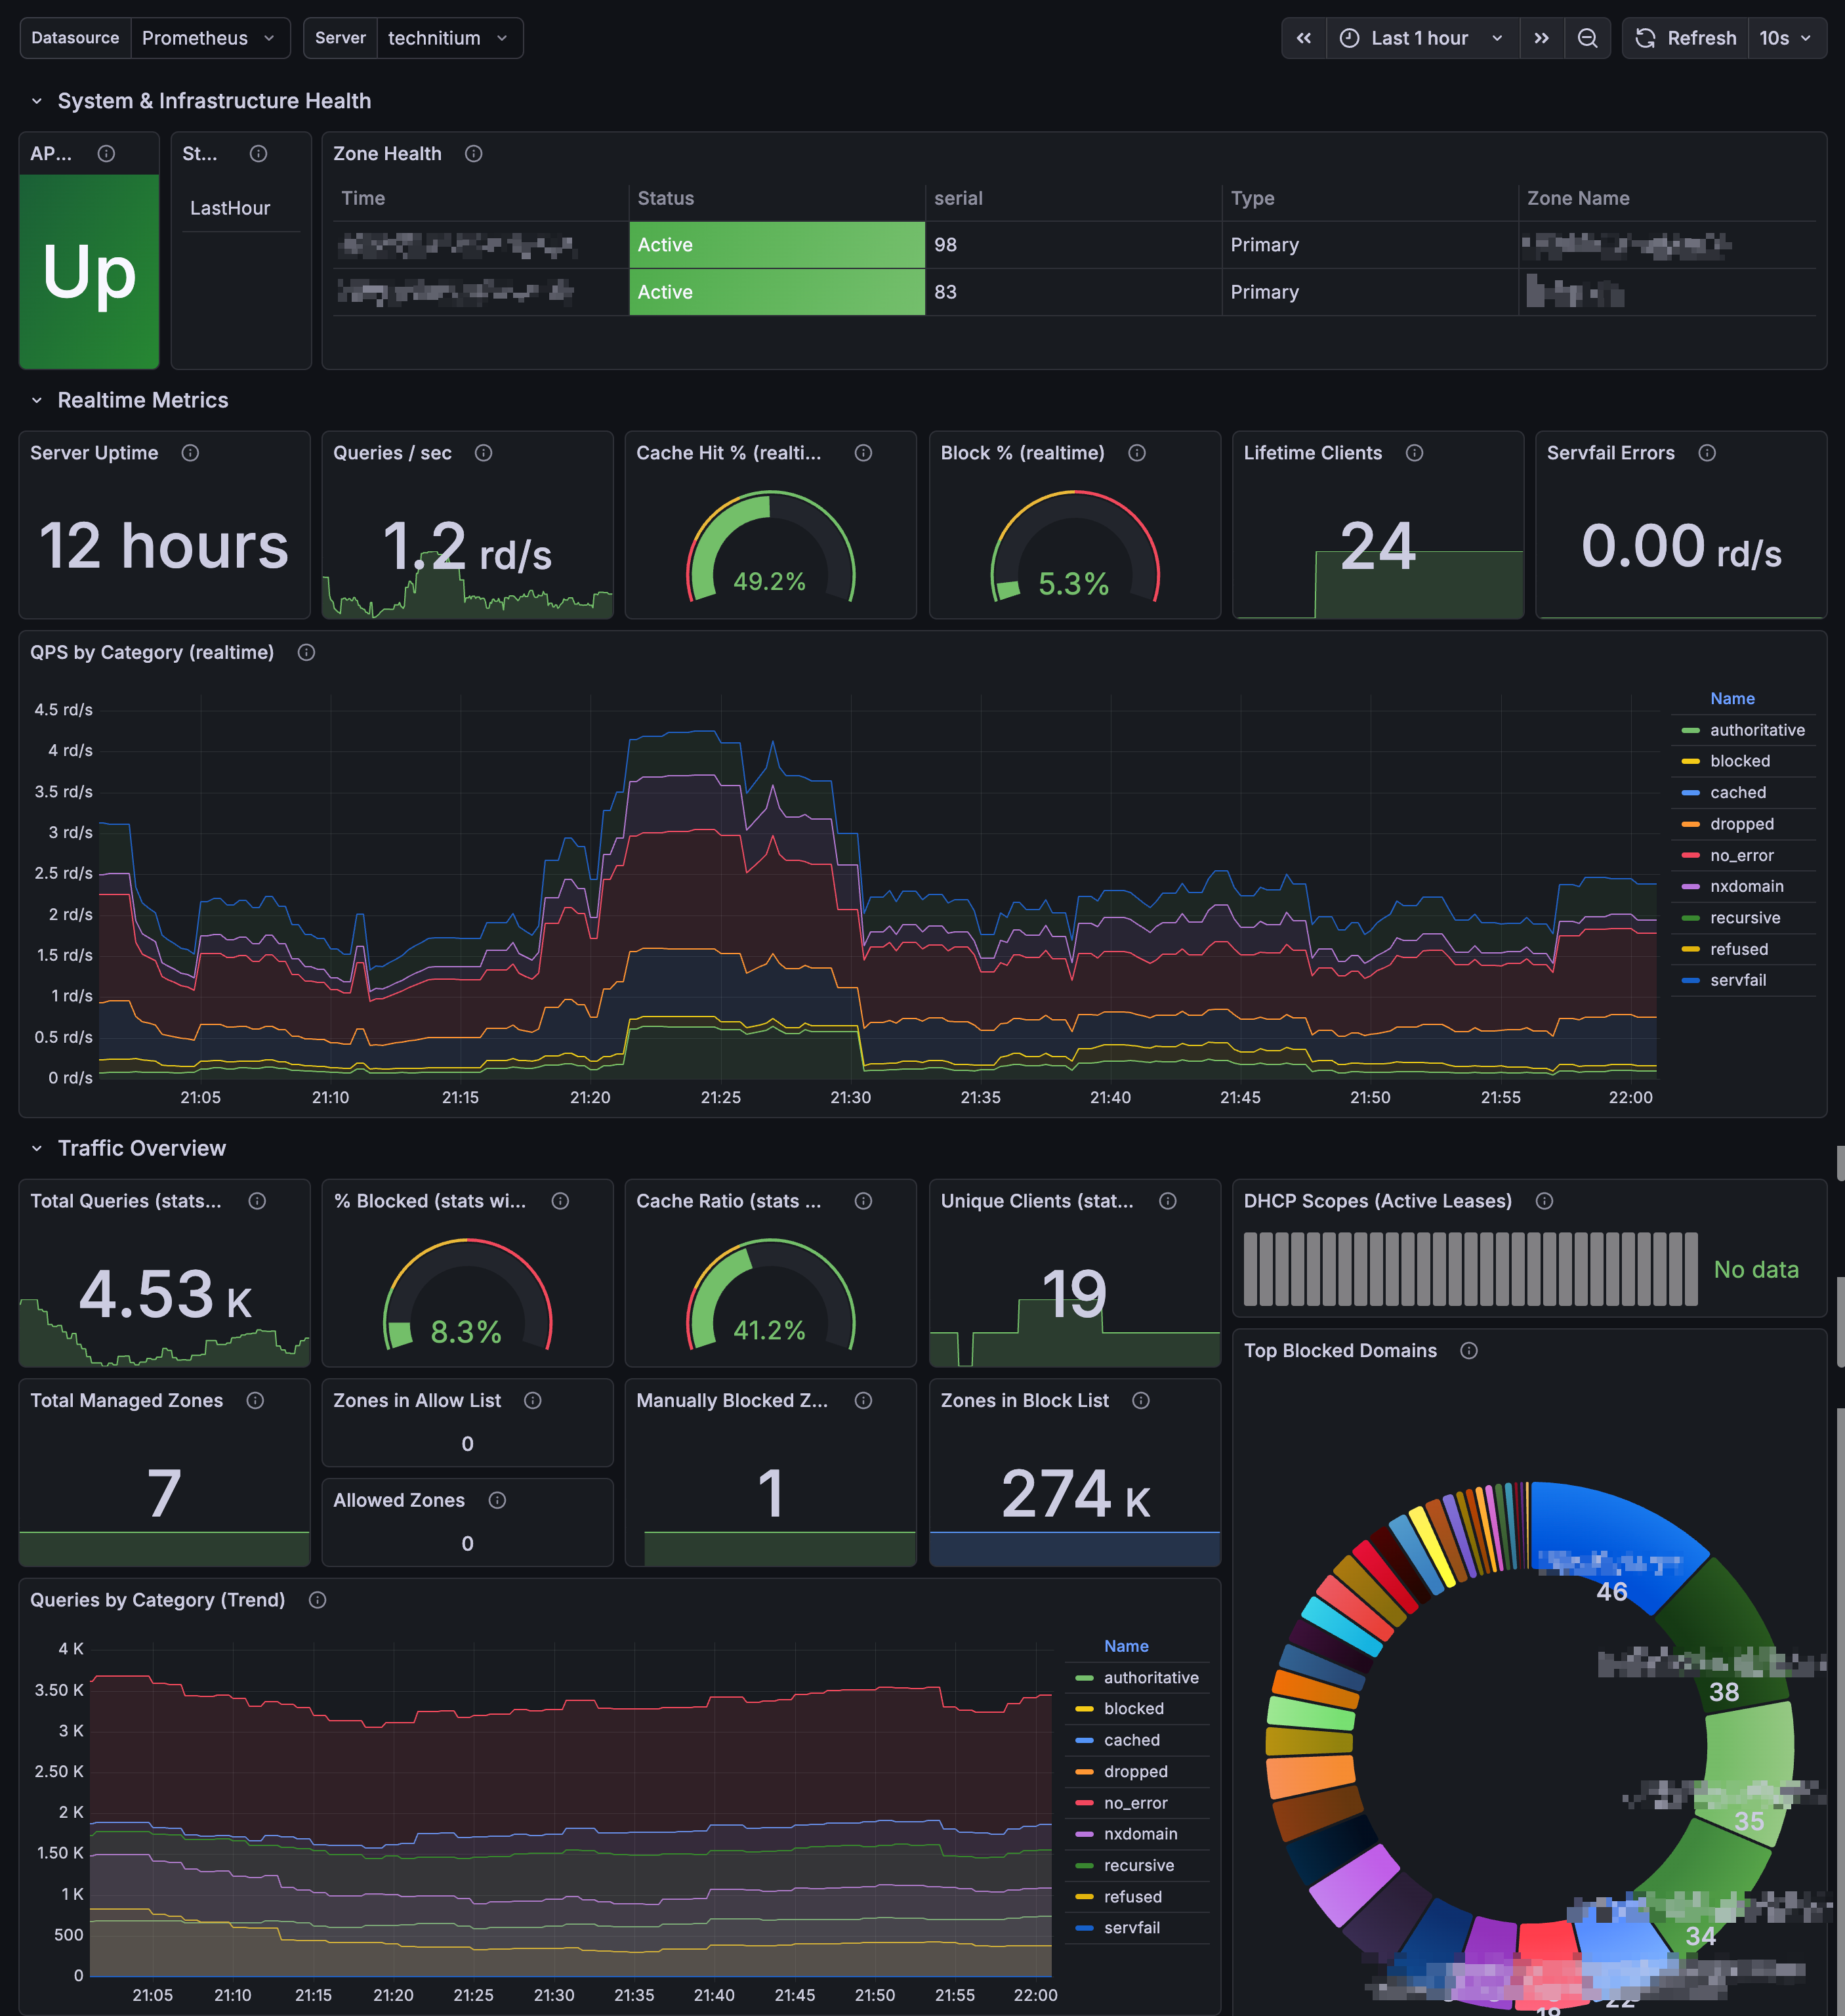
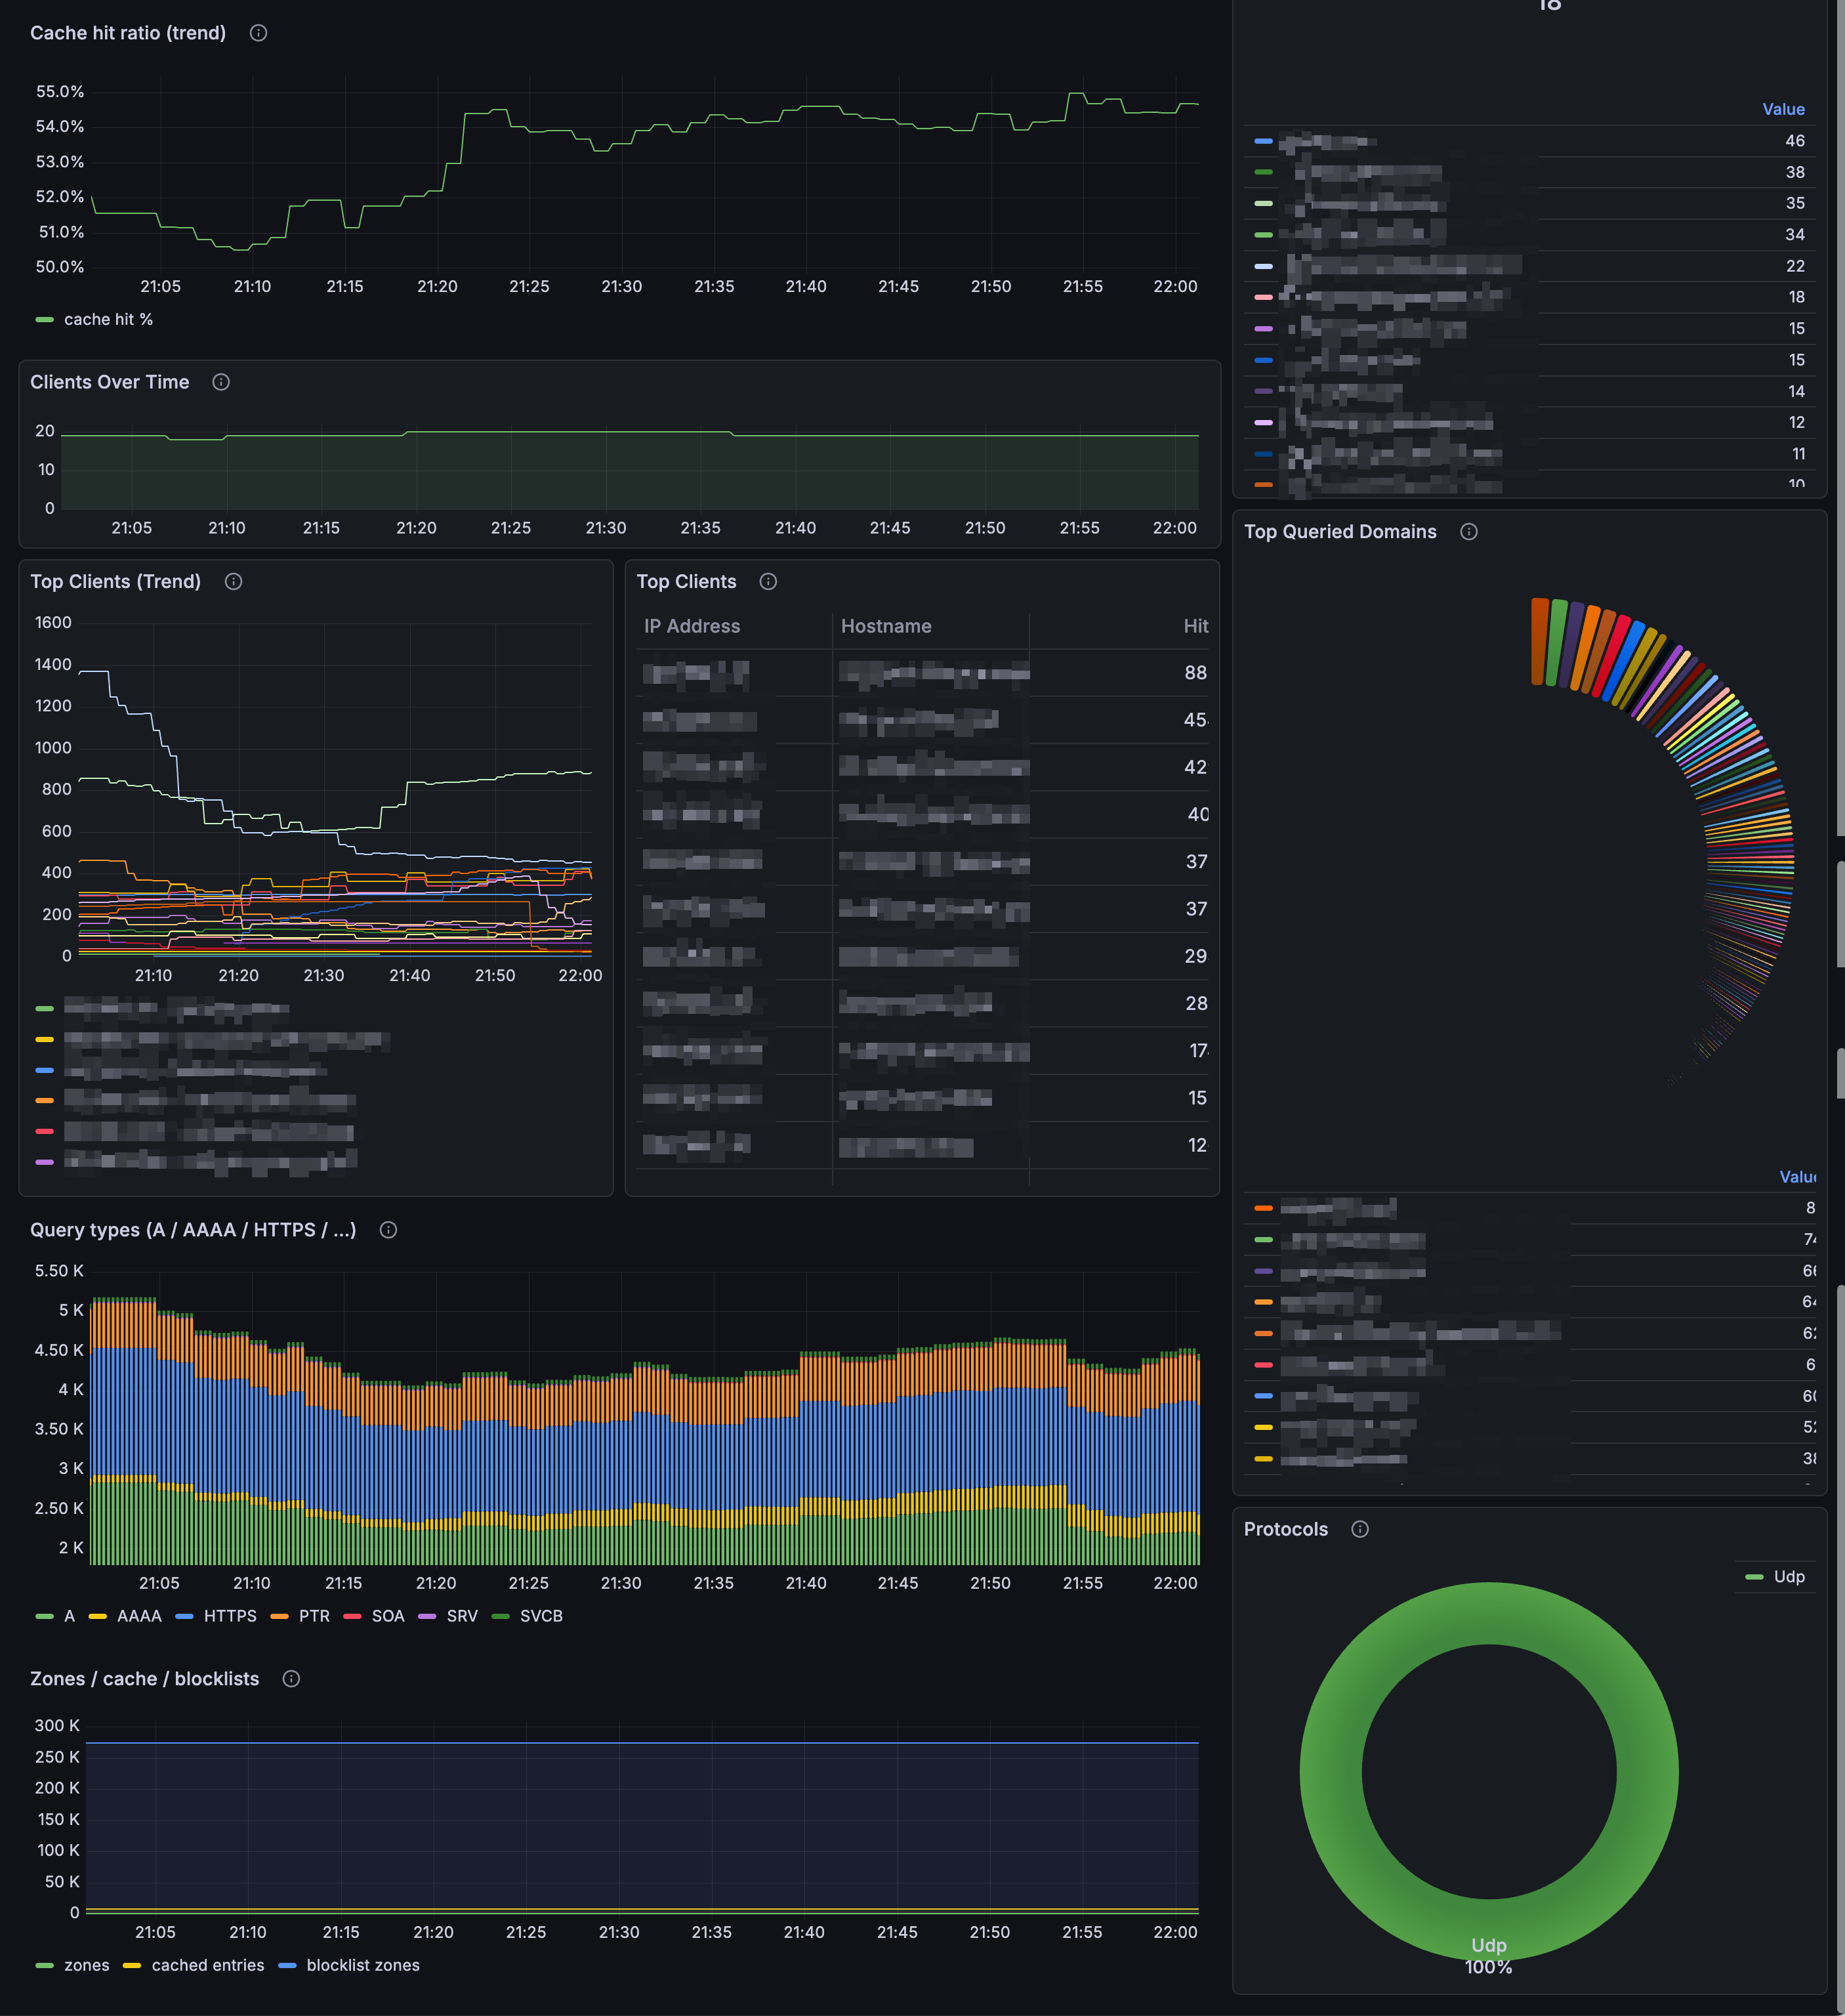
Technitium DNS Dashboard (Python Exporter). Shows snapshot DNS stats for the selected Technitium stats window (LastHour / LastDay / etc) plus time-series trends calculated by Prometheus.
Dashboard for Technitium DNS Prometheus Exporter https://github.com/guycalledseven/technitium-dns-prometheus-exporter.
Inspired by pihole-exporter and Pi-hole Exporter Grafana dashboard. After migrating from Pi-hole to Technitium, I couldn’t find any exporter that provided the metrics I needed while remaining simple and reliable — so I built one.
Supports Realtime and Window-based metrics: Supports monotonic counters since server start (Realtime Metrics) from Technitium's v15 and window based metrics (Traffic Overview)
Data source config
Collector config:
Upload an updated version of an exported dashboard.json file from Grafana
| Revision | Description | Created | |
|---|---|---|---|
| Download |