VictoriaMetrics - Alert statistics
Overview of alerts state in time based on metrics generated by VictoriaMetrics vmalert.
Alerts statistics overview
Requirements
Panels are based on metrics exposed by vmalert, VictoriaMetrics component for evaluation alerting and recording rules.
Use Prometheus datasource with this dashboard. See more details about how to configure monitoring here.
Description
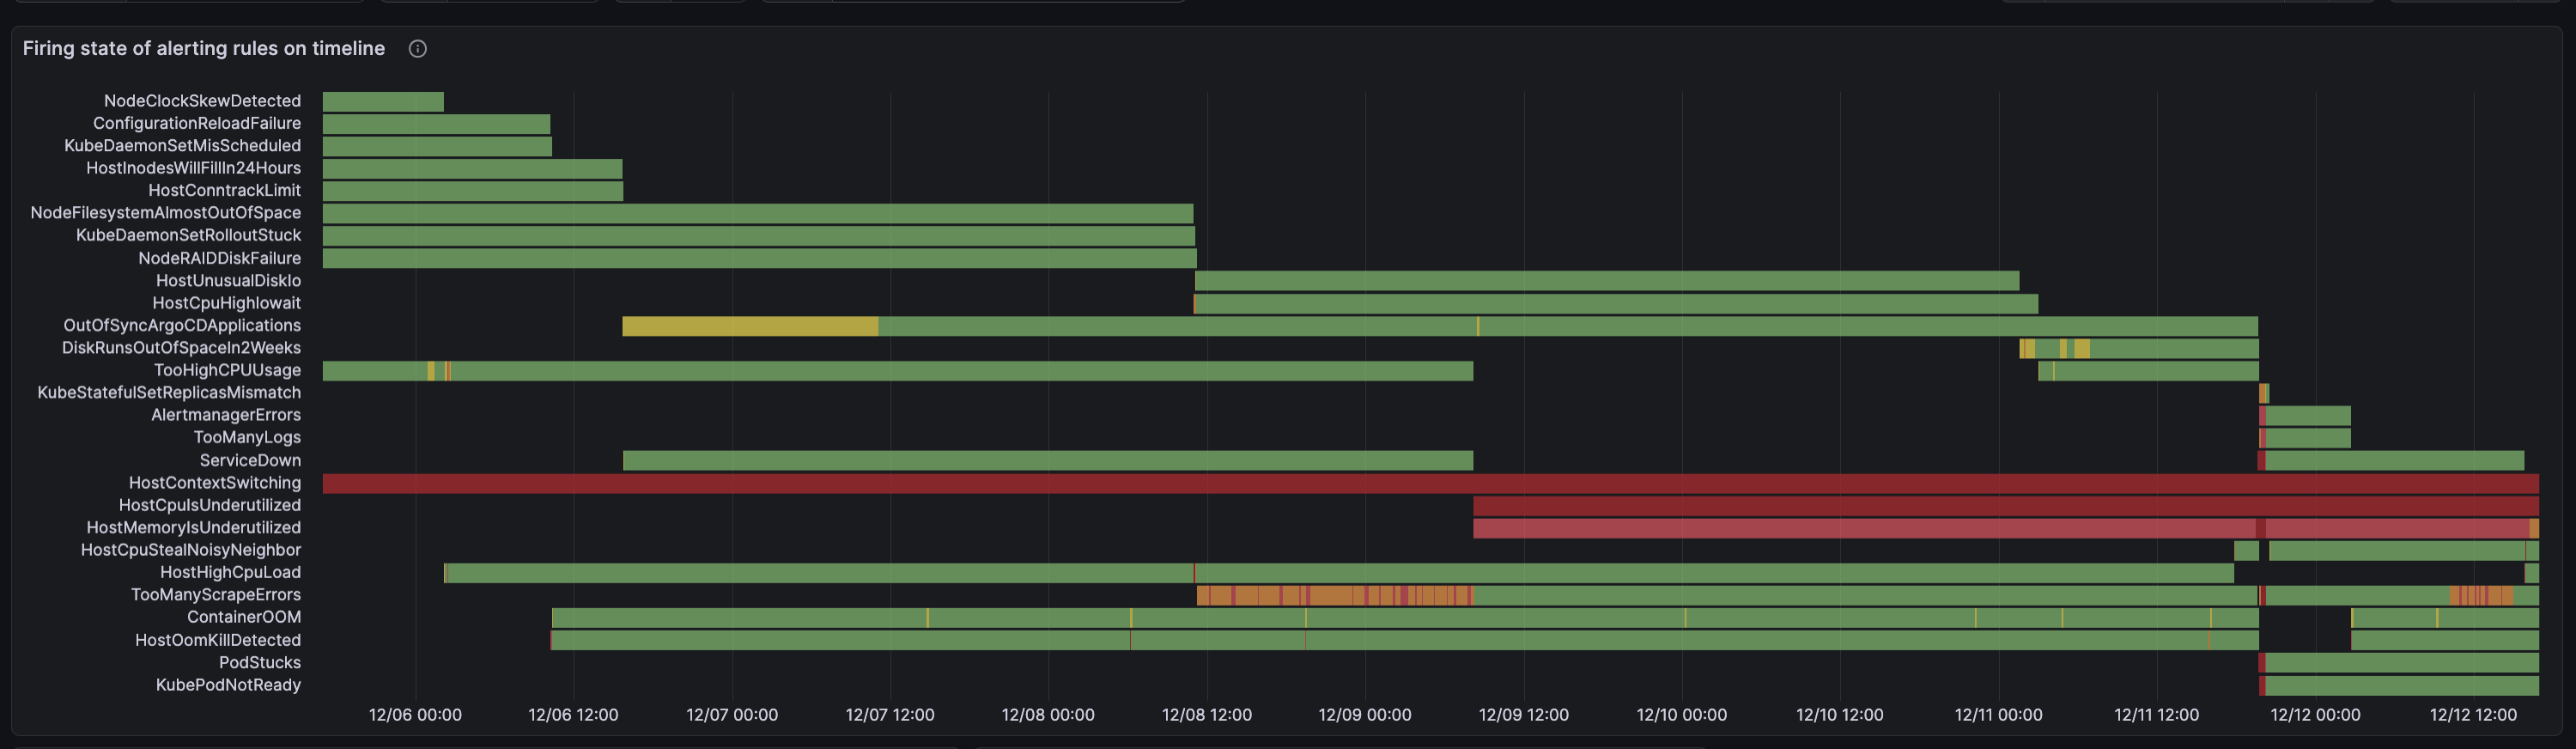
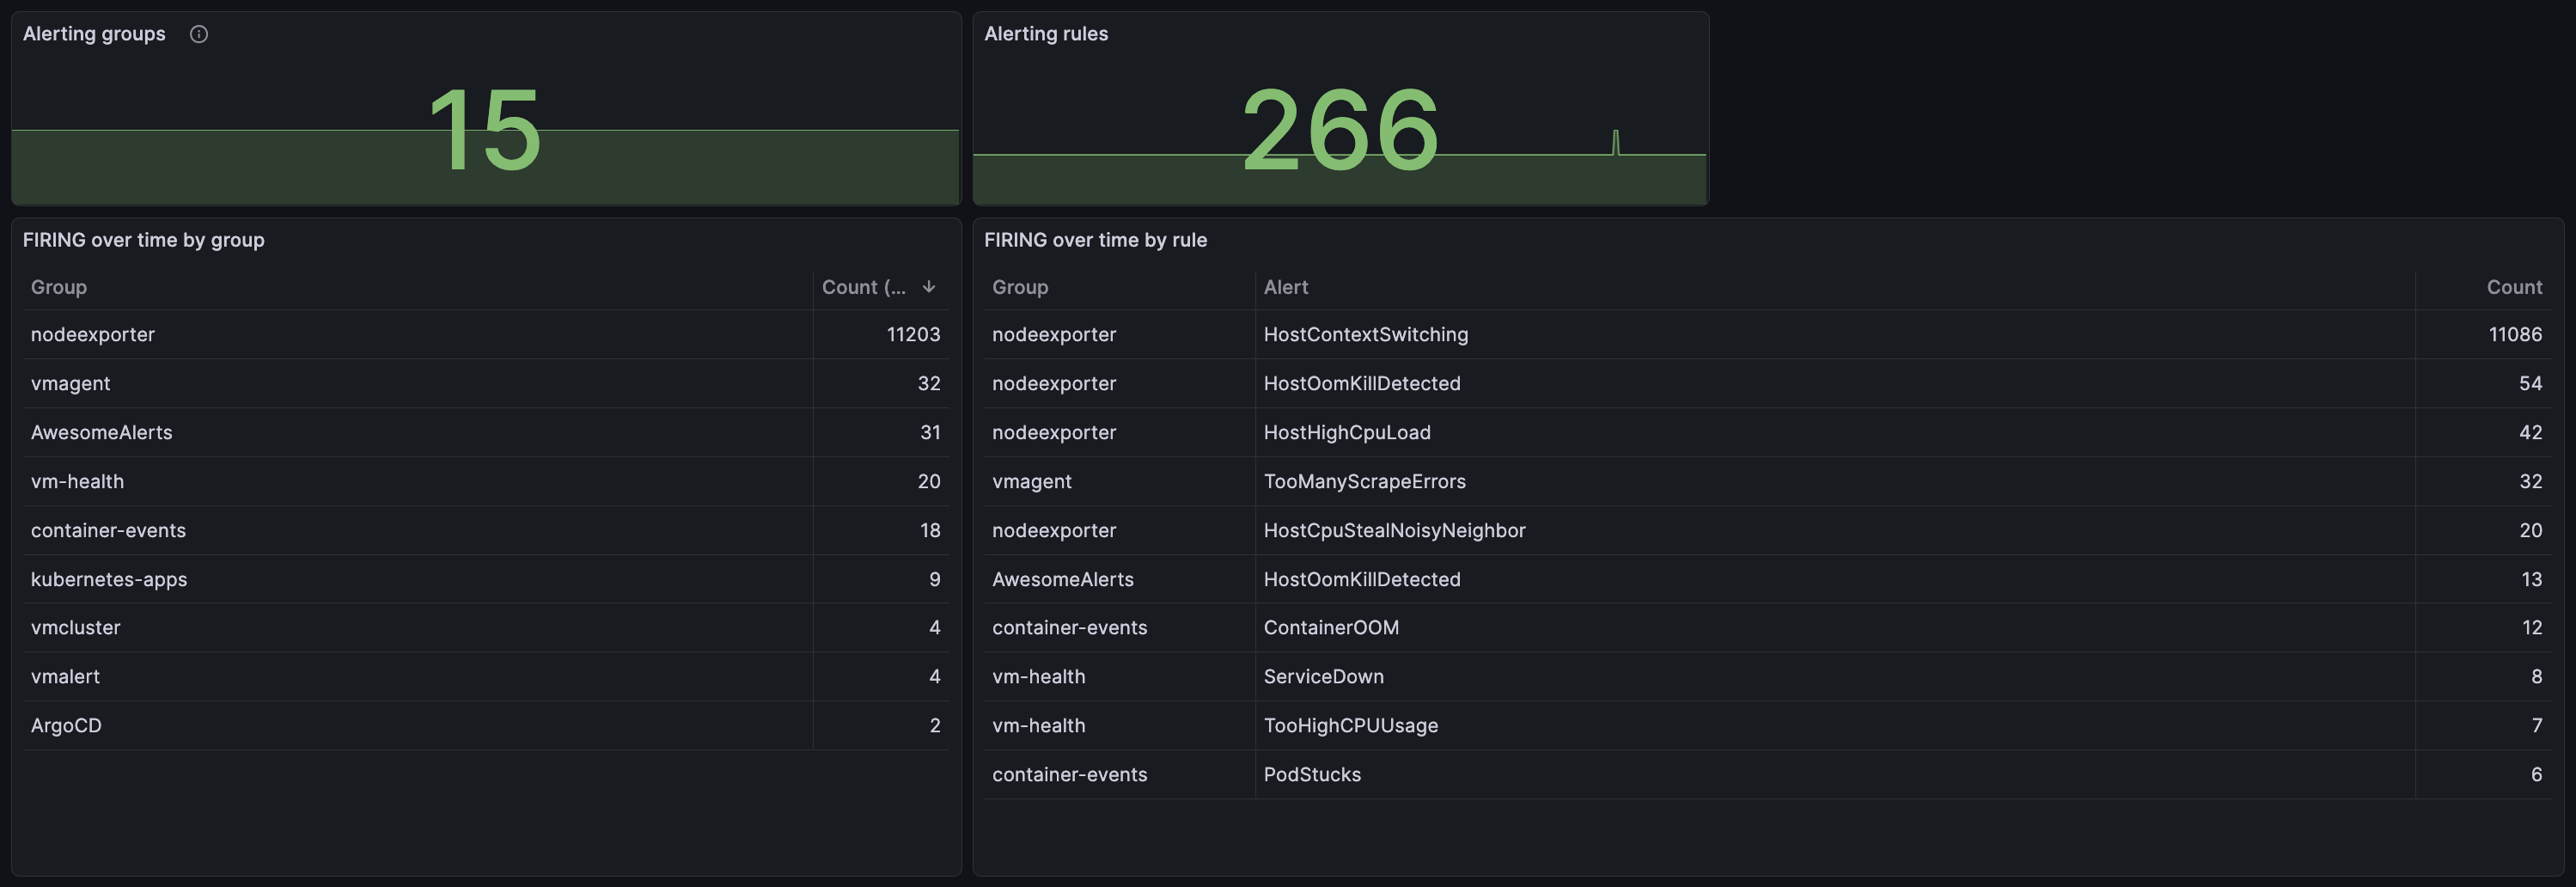
The dashboard contains aggregated information about alerting rules and groups. It displays the historical state of the alerts to highlight how frequently they fired in the past.
If you have suggestions for improvements or discover any issues, please feel free to create an issue or submit feedback through the dashboard review system.
More information about VictoriaMetrics can be found in the official documentation.
Data source config
Collector config:
Upload an updated version of an exported dashboard.json file from Grafana
| Revision | Description | Created | |
|---|---|---|---|
| Download |