QNAP SNMP
A dashboard for visualizing collected QNAP NAS Storage data from the target's SNMP port using Telegraf.
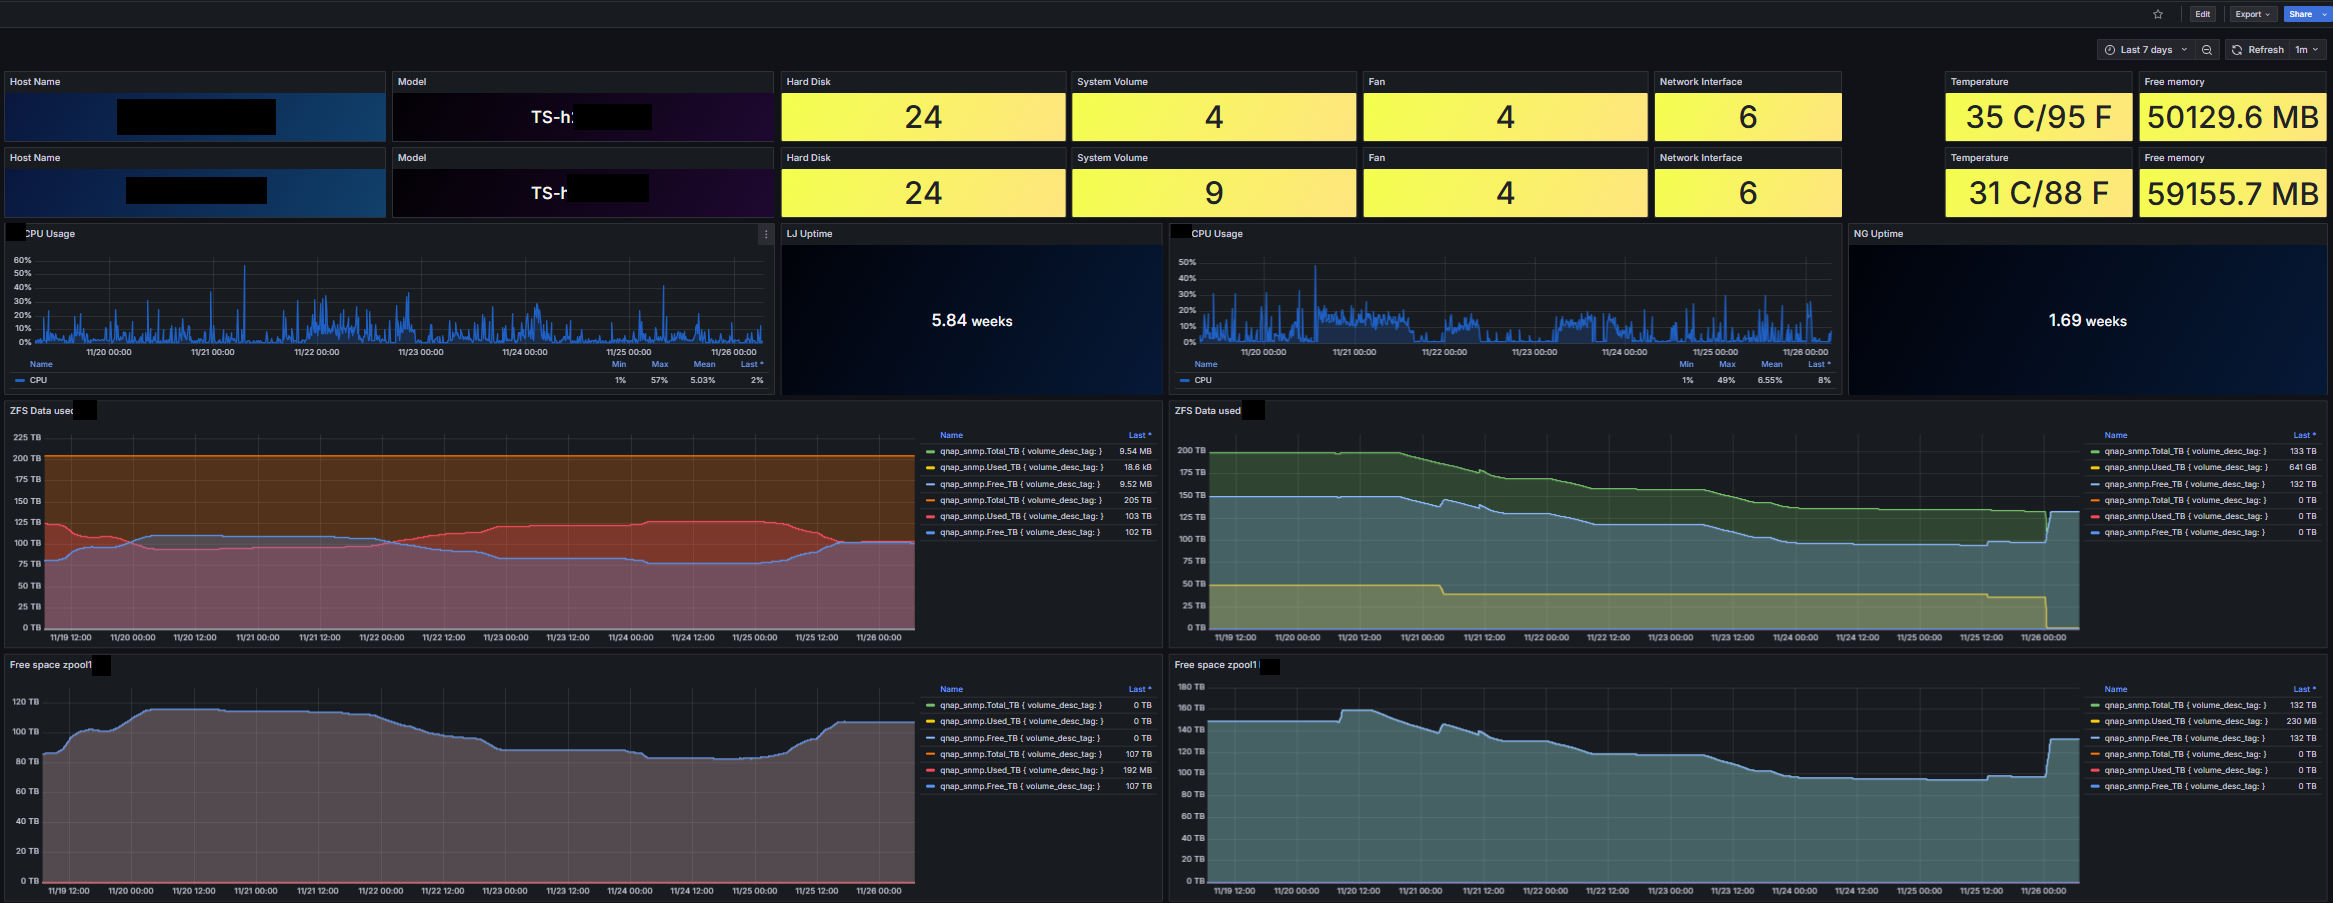
The QNAP SNMP dashboard uses the influxdb data source to create a Grafana dashboard with the stat, table and timeseries panels.
Data source config
Collector type:
Collector plugins:
Collector config:
Revisions
Upload an updated version of an exported dashboard.json file from Grafana
| Revision | Description | Created | |
|---|---|---|---|
| Download |
SNMP
Easily monitor any generic SNMP (Simple Network Management Protocol) device with Grafana Cloud's out-of-the-box monitoring solution.
Learn more