AWS EKS Cloudwatch Logs
AWS EKS CloudWatch Logs dashboard with Kubernetes namespace and container filtering. Shows log histogram and detailed log viewer.
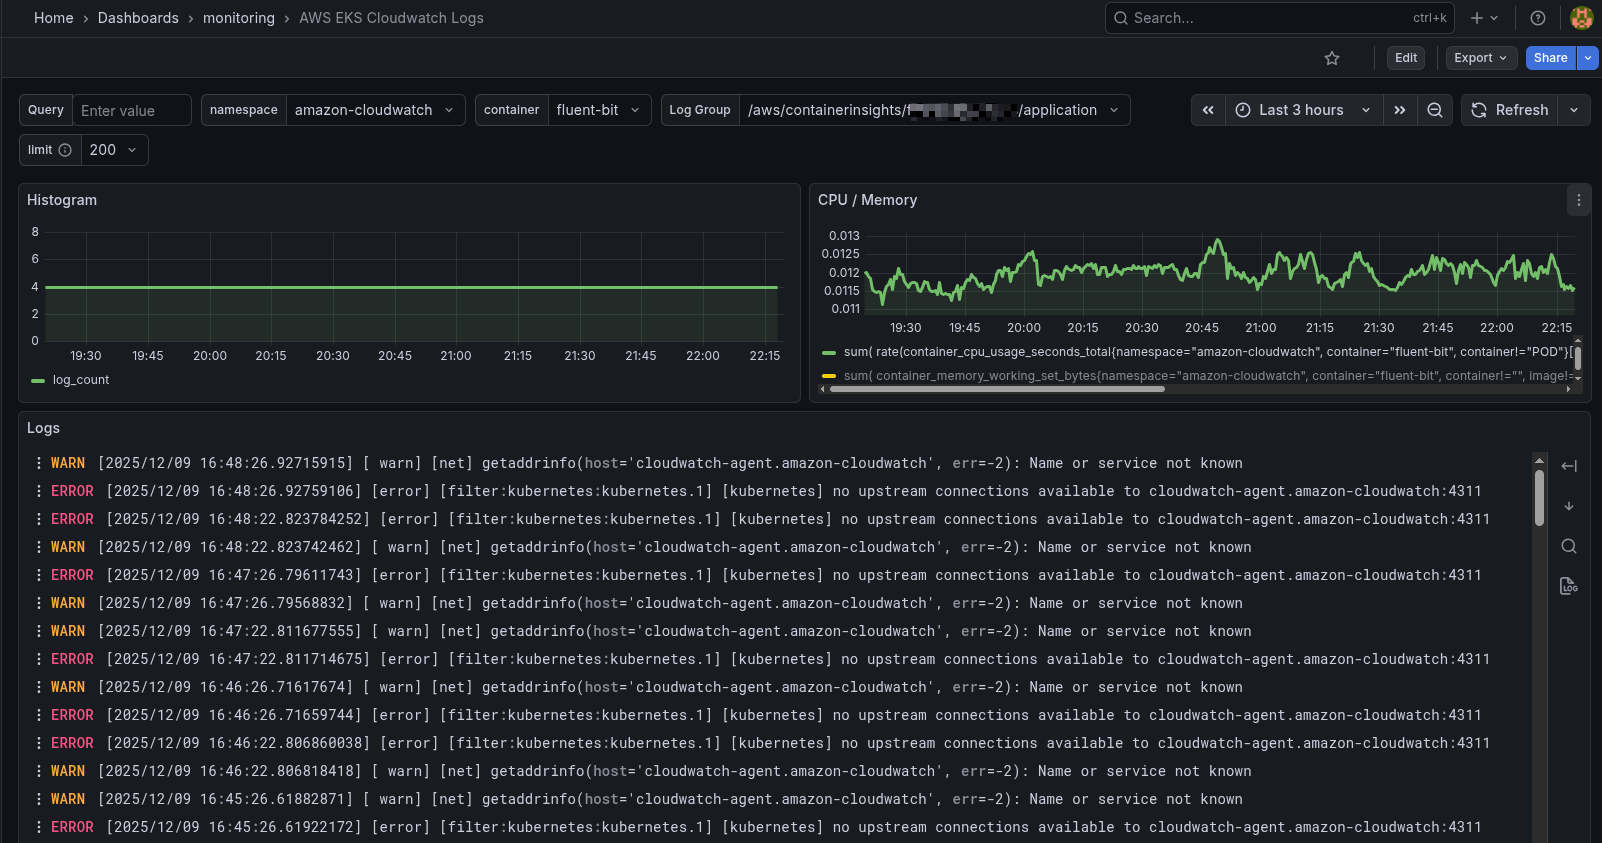
The AWS EKS Cloudwatch Logs dashboard uses the cloudwatch and prometheus data sources to create a Grafana dashboard with the logs and timeseries panels.
Data source config
Collector type:
Collector plugins:
Collector config:
Revisions
Upload an updated version of an exported dashboard.json file from Grafana
| Revision | Description | Created | |
|---|---|---|---|
| Download |
AWS
Easily visualize and alert on more than 60 Amazon Web Services (AWS) resources using the fully managed Grafana Cloud platform.
Learn more