DCGM Exporter Dashboard
This dashboard is to display the metrics from DCGM Exporter
DCGM Exporter Dashboard
Overview
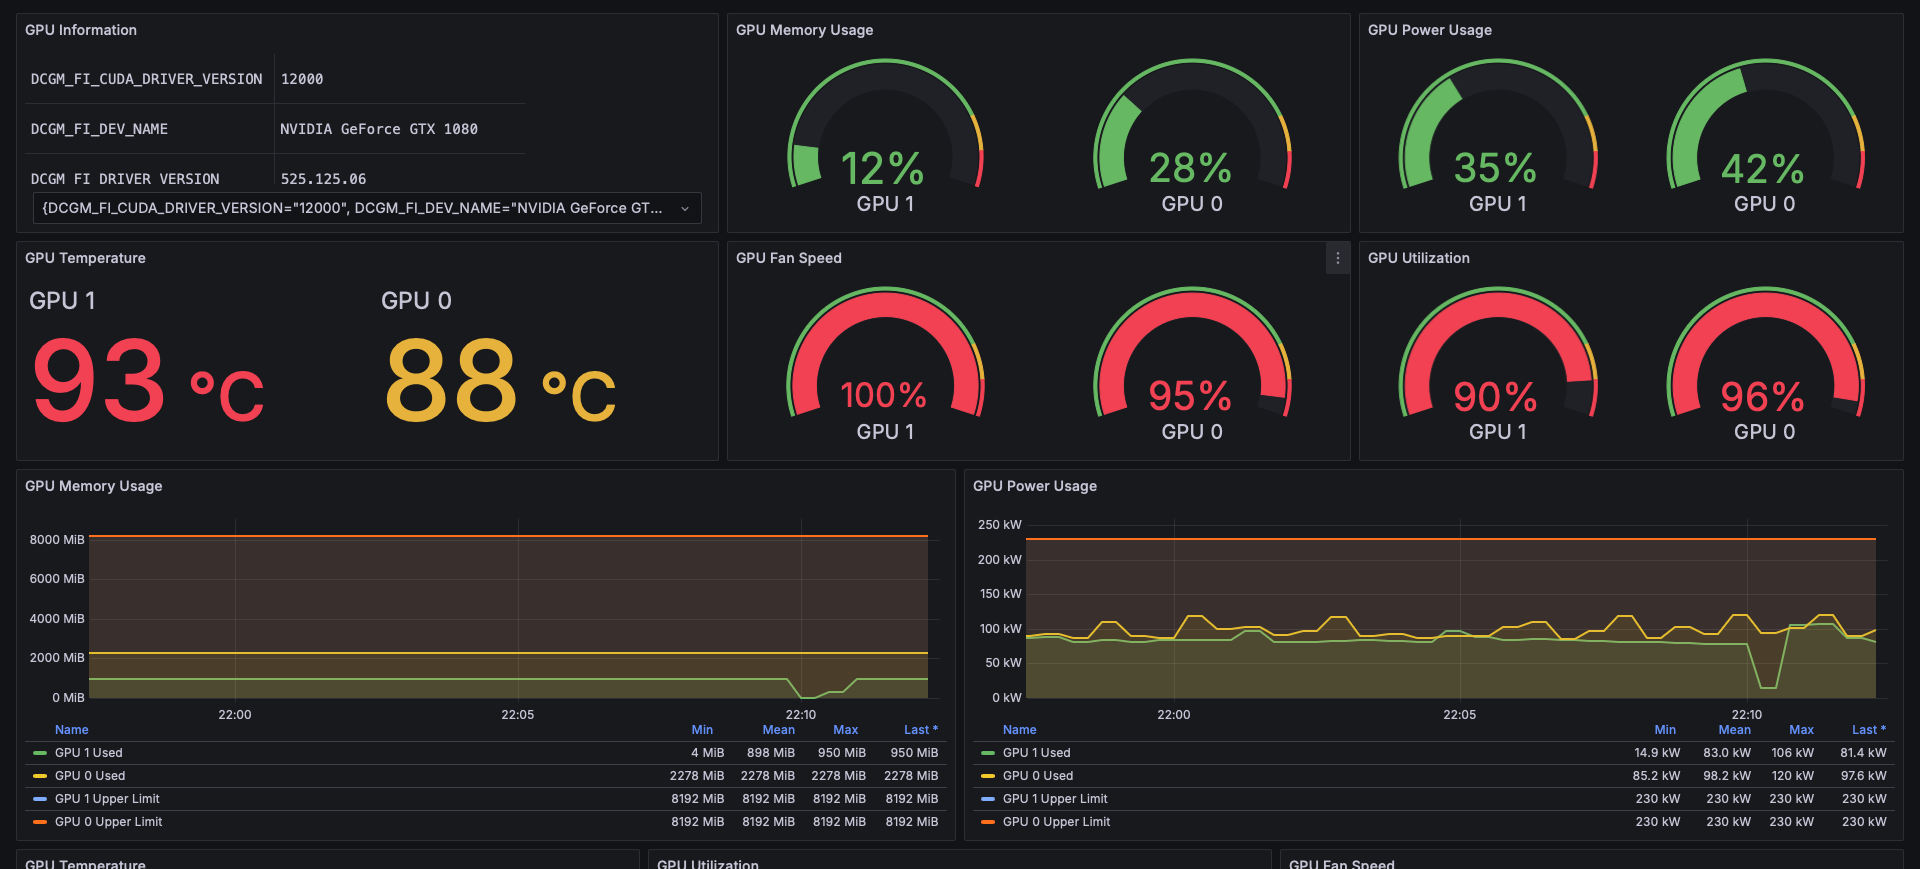
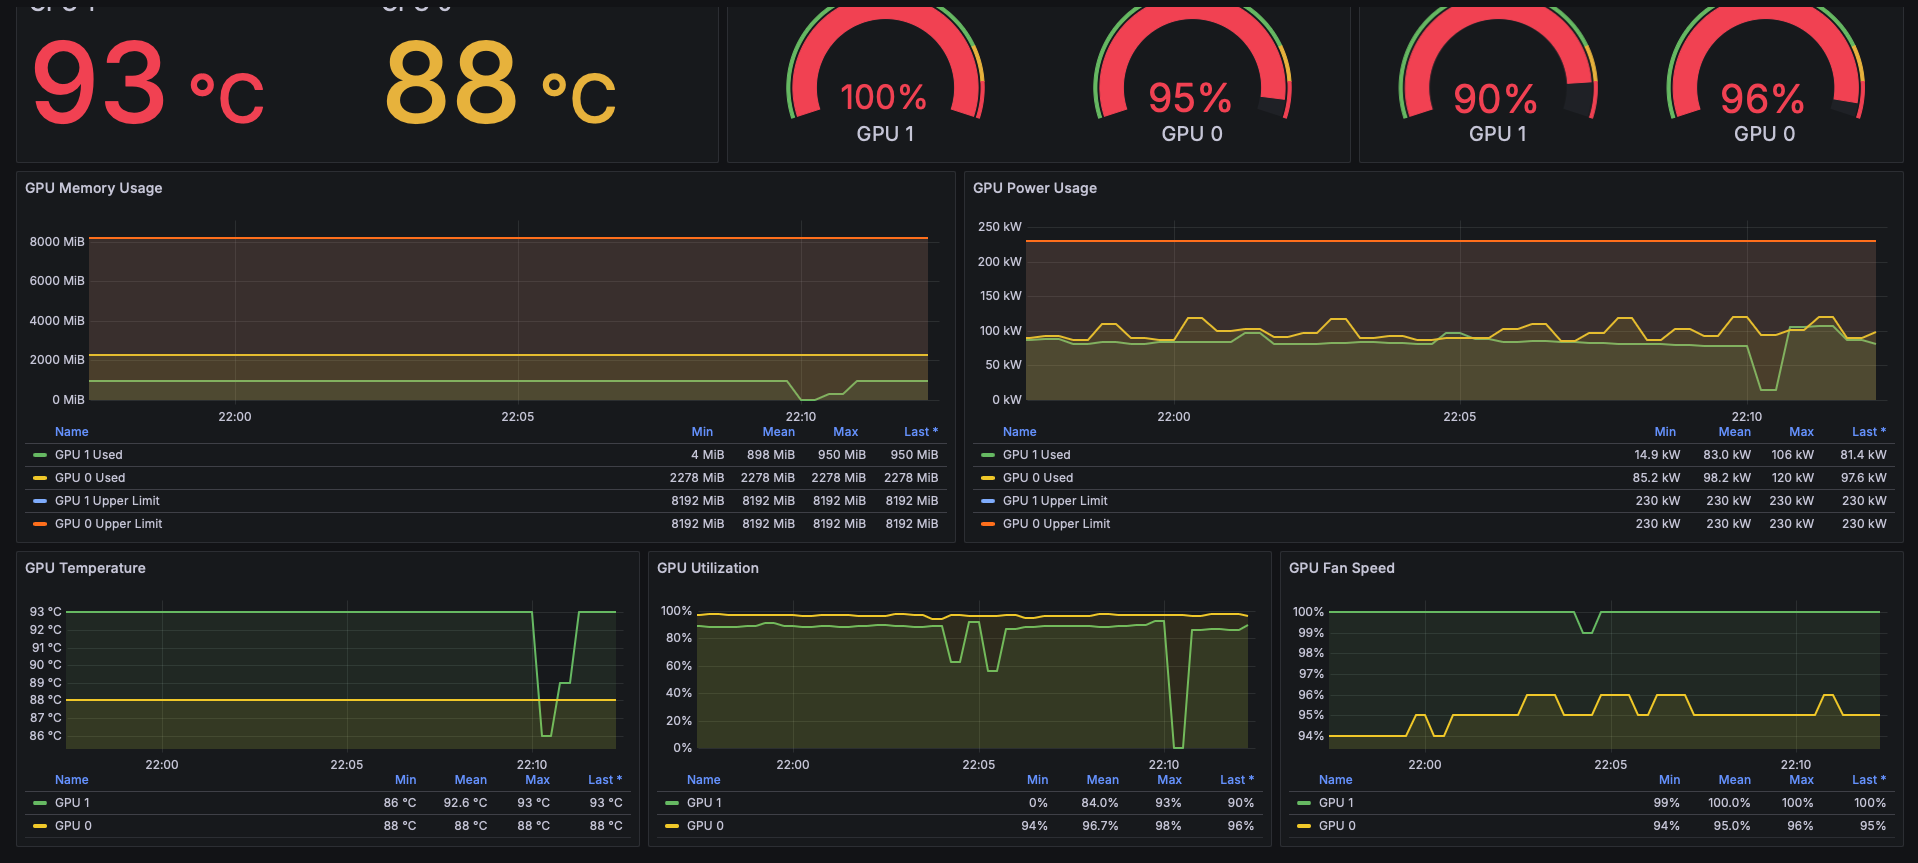
This dashboard visualizes GPU metrics exported by NVIDIA DCGM Exporter. It provides an interface similar to the standard nvidia-smi command but with historical data and graphical visualization.
It is designed to be simple and lightweight, focusing on the most critical metrics for monitoring GPU health and performance.
概要 (Japanese)
NVIDIA DCGM Exporter のメトリクスを可視化するダッシュボードです.
CLIツールの nvidia-smi で確認できる主要な情報を,Grafana上で時系列データとしてグラフィカルに監視できるように設計しています.
Features / 機能
- GPU Information: Model Name, Driver Version, CUDA Version / GPU情報 (モデル名,ドライババージョン,CUDAバージョン)
- GPU Utilization: Real-time GPU usage (%) / GPU使用率
- Memory Usage: VRAM usage and total capacity (% & MiB) / メモリ使用量と上限
- Power Usage: Power consumption and power limit (% & W) / 消費電力と上限
- Fan Speed: Fan speed (%) / ファン回転数
- Temperature: GPU Temperature (°C) / 温度
Requirements / 必須要件
- Prometheus
- NVIDIA DCGM Exporter (running on Kubernetes or Docker)
Configuration / 設定
- Import this dashboard.
- Select your Prometheus data source.
- Choose the
instanceandgpuidentifiers from the dropdown menu.
Data source config
Collector type:
Collector plugins:
Collector config:
Revisions
Upload an updated version of an exported dashboard.json file from Grafana
| Revision | Description | Created | |
|---|---|---|---|
| Download |