Service Health - Golden Signals
This dashboard template visualizes key service health metrics such as traffic, error rate, latency, and CPU saturation. It provides both aggregated views and a detailed endpoint breakdown to help identify bottlenecks and monitor system reliability and capacity.
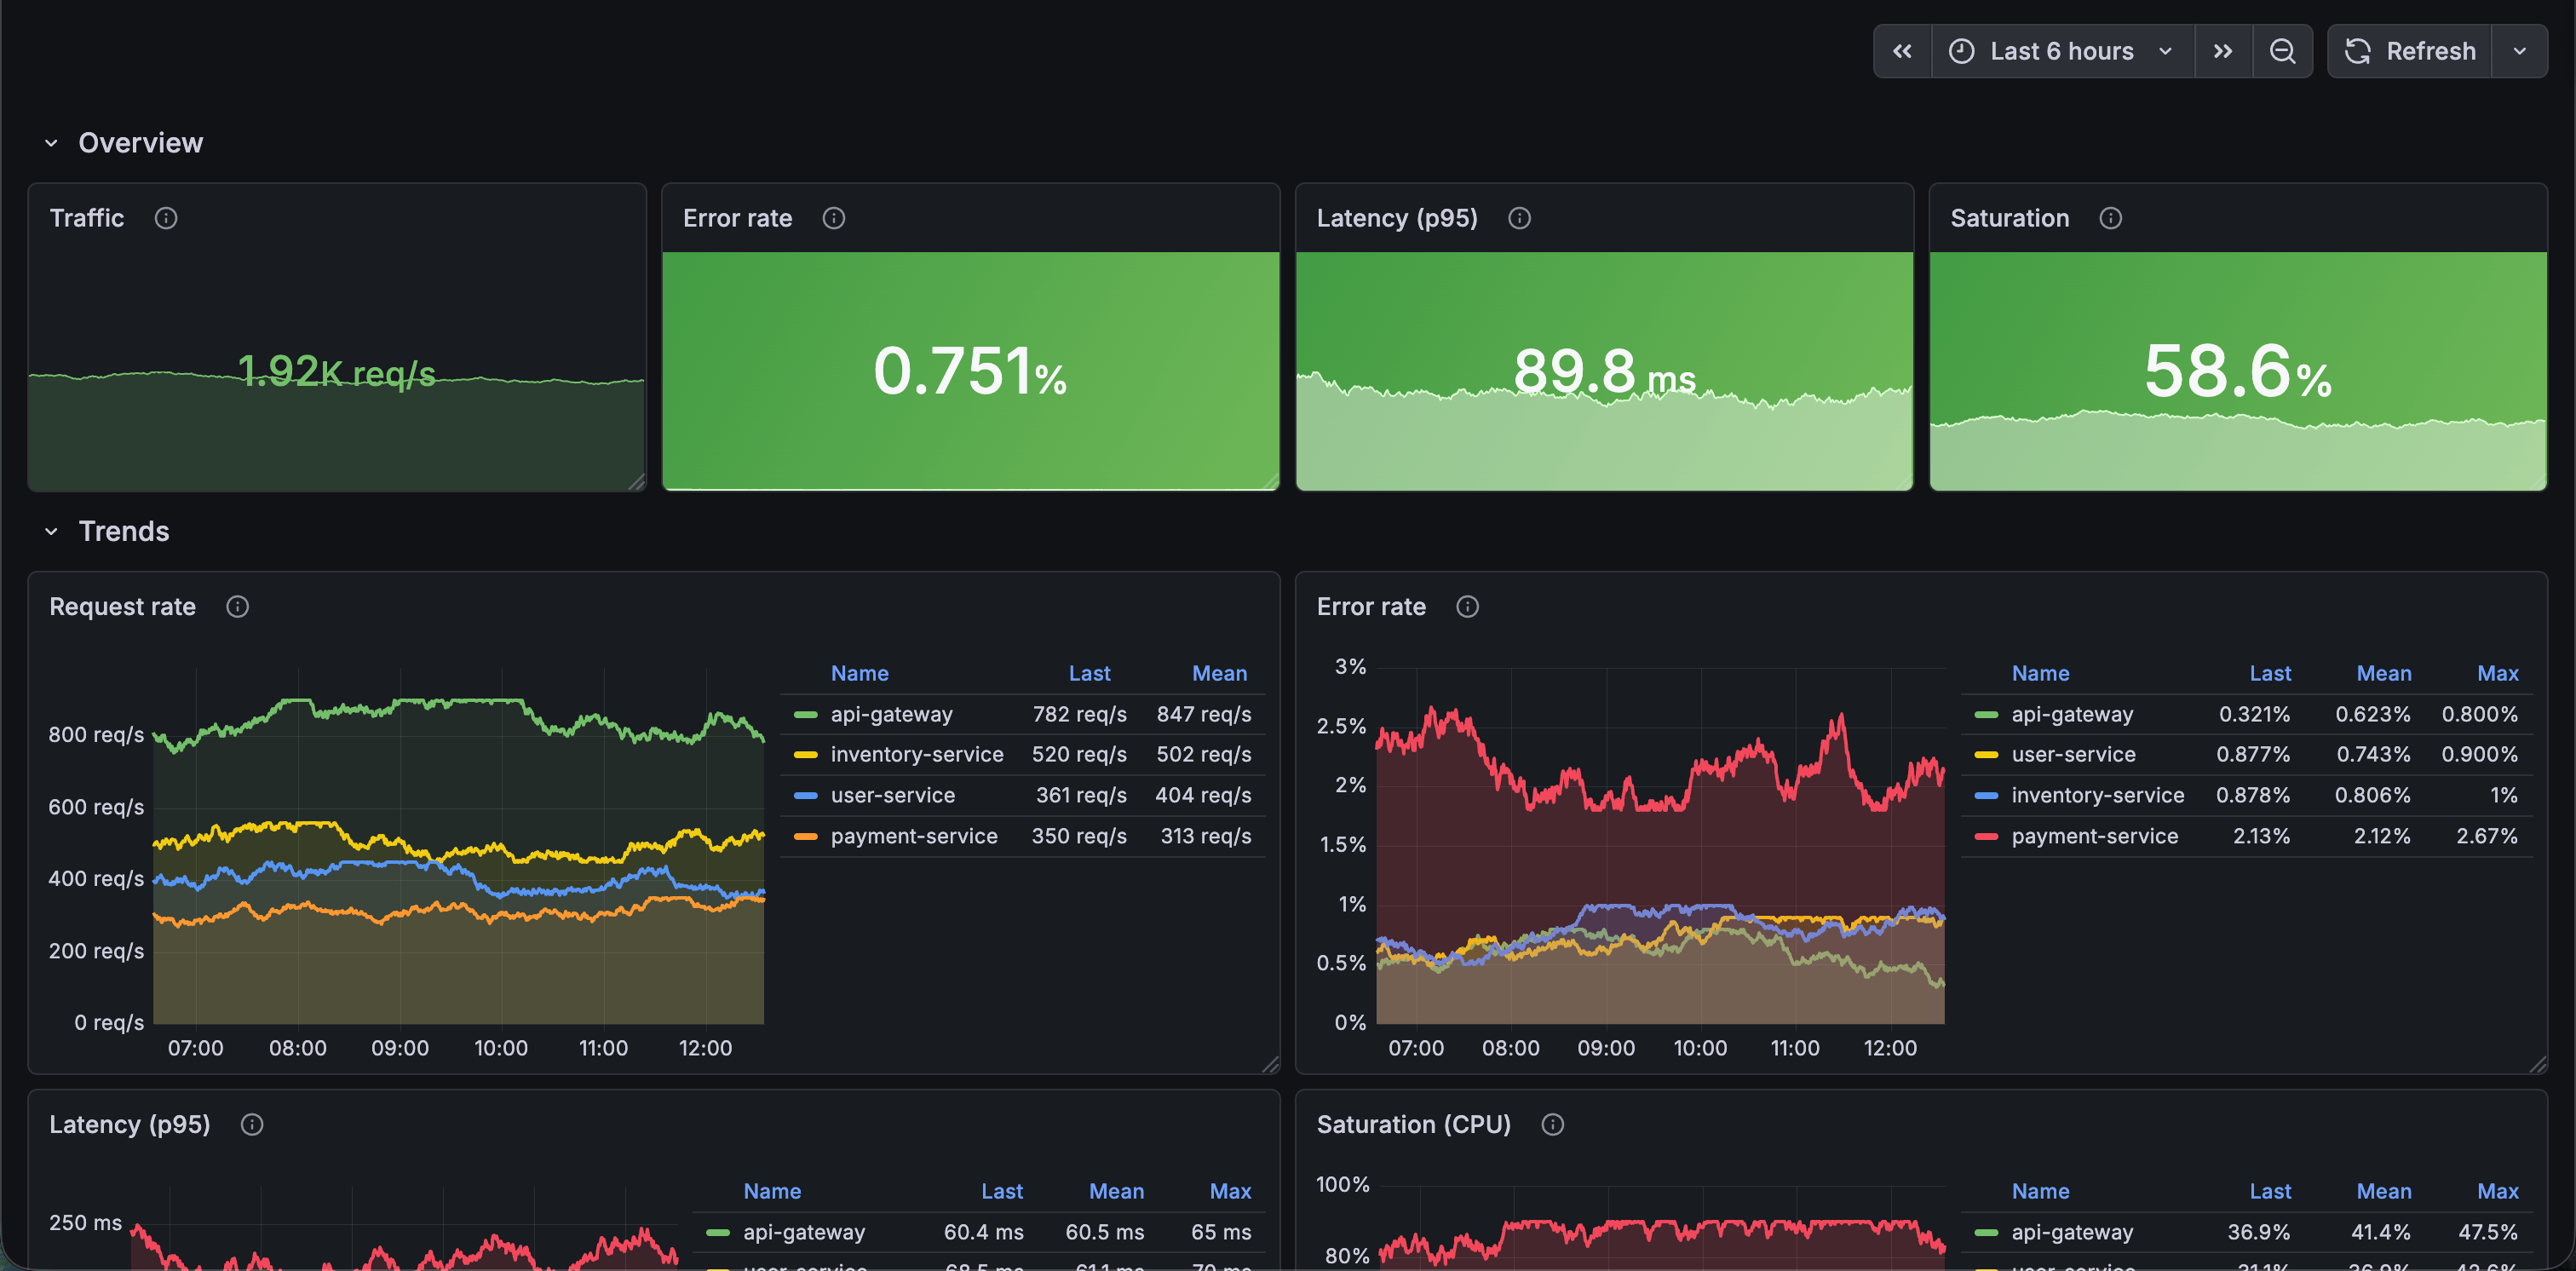
Service Health - Template dashboard
Data source config
Collector type:
Collector plugins:
Collector config:
Revisions
Upload an updated version of an exported dashboard.json file from Grafana
| Revision | Description | Created | |
|---|---|---|---|
| Download |