Archestra Platform
Pre-built dashboard highlighting key LLM usage + cost metrics, blocked MCP tool calls, and LLM request traces https://github.com/archestra-ai/archestra
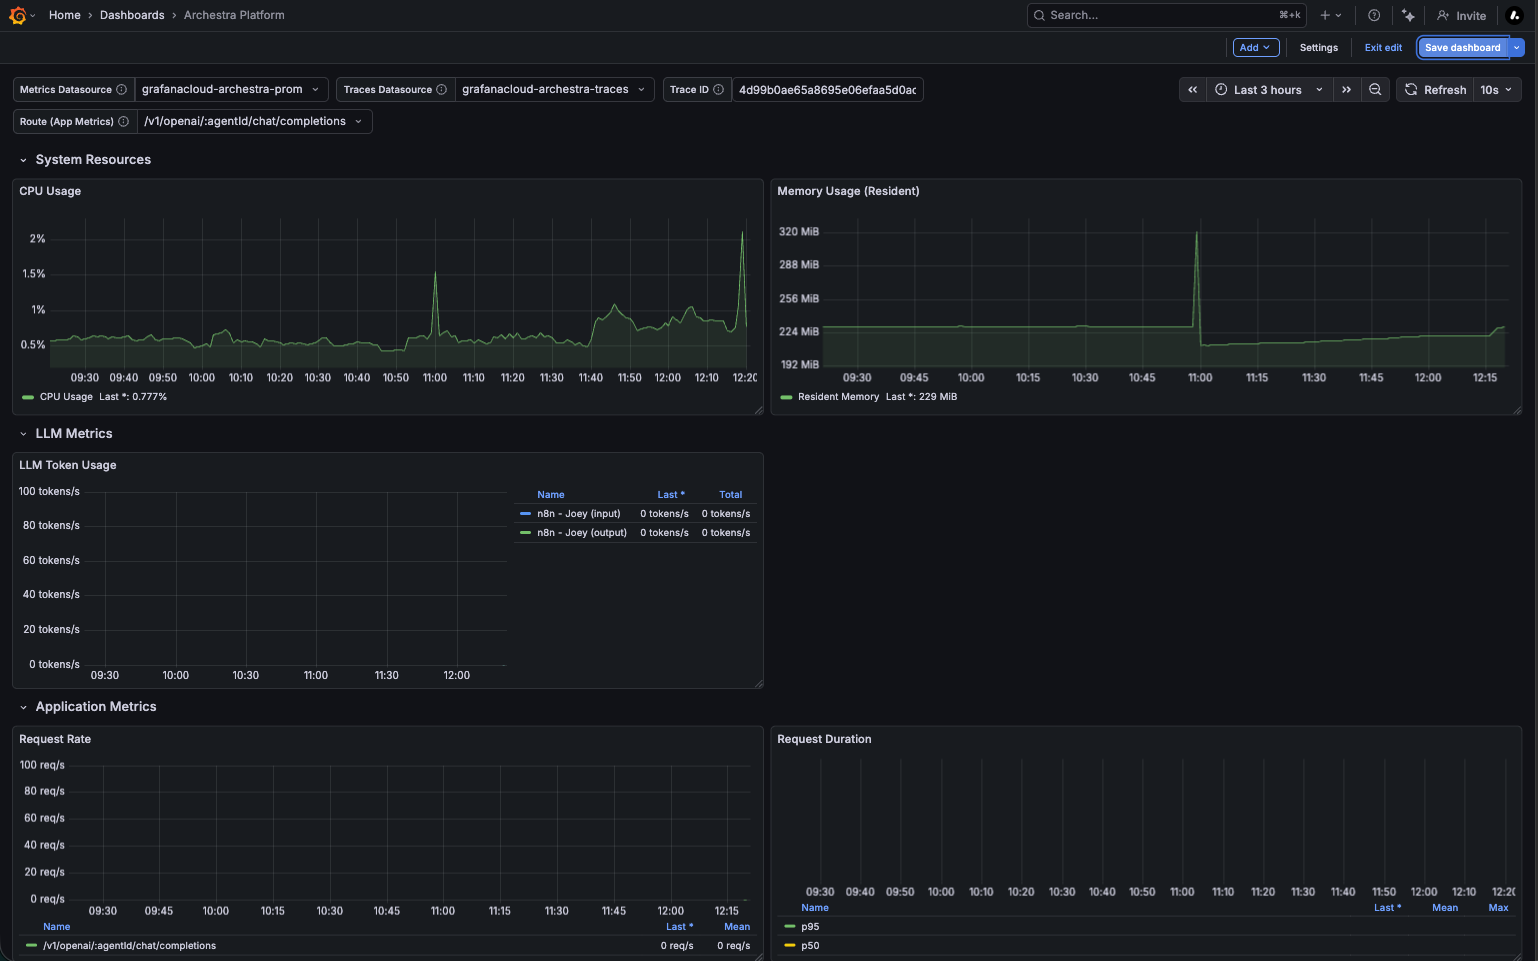
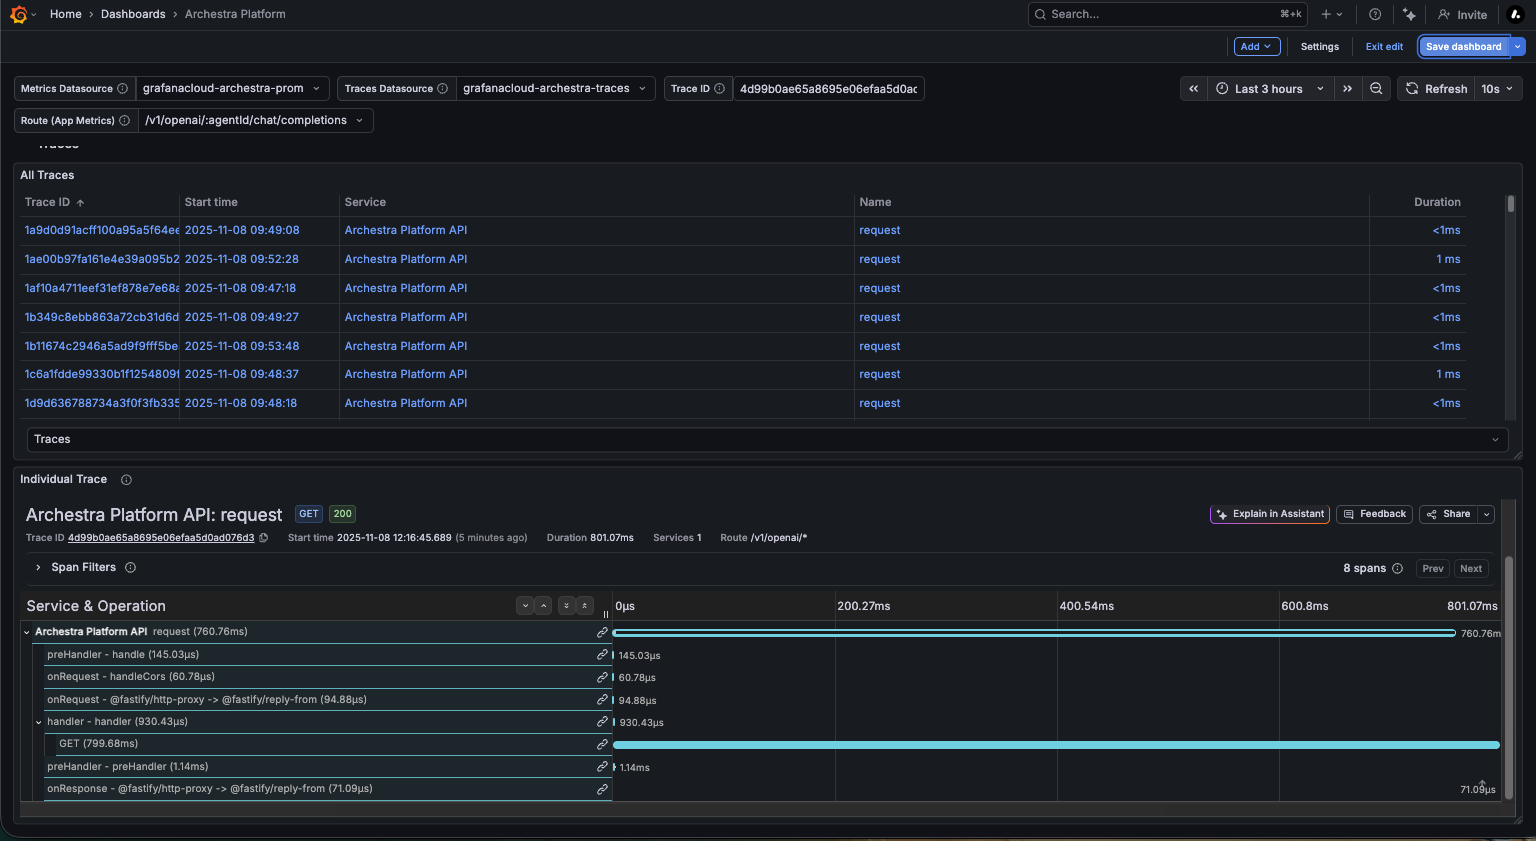
The Archestra Platform dashboard uses the prometheus and tempo data sources to create a Grafana dashboard with the table, timeseries and traces panels.
Data source config
Collector type:
Collector plugins:
Collector config:
Revisions
Upload an updated version of an exported dashboard.json file from Grafana
| Revision | Description | Created | |
|---|---|---|---|
| Download |