ntpd-rs
Dashboard for ntpd-rs own metrics exporter, containing (hopefully) all the exported metrics.
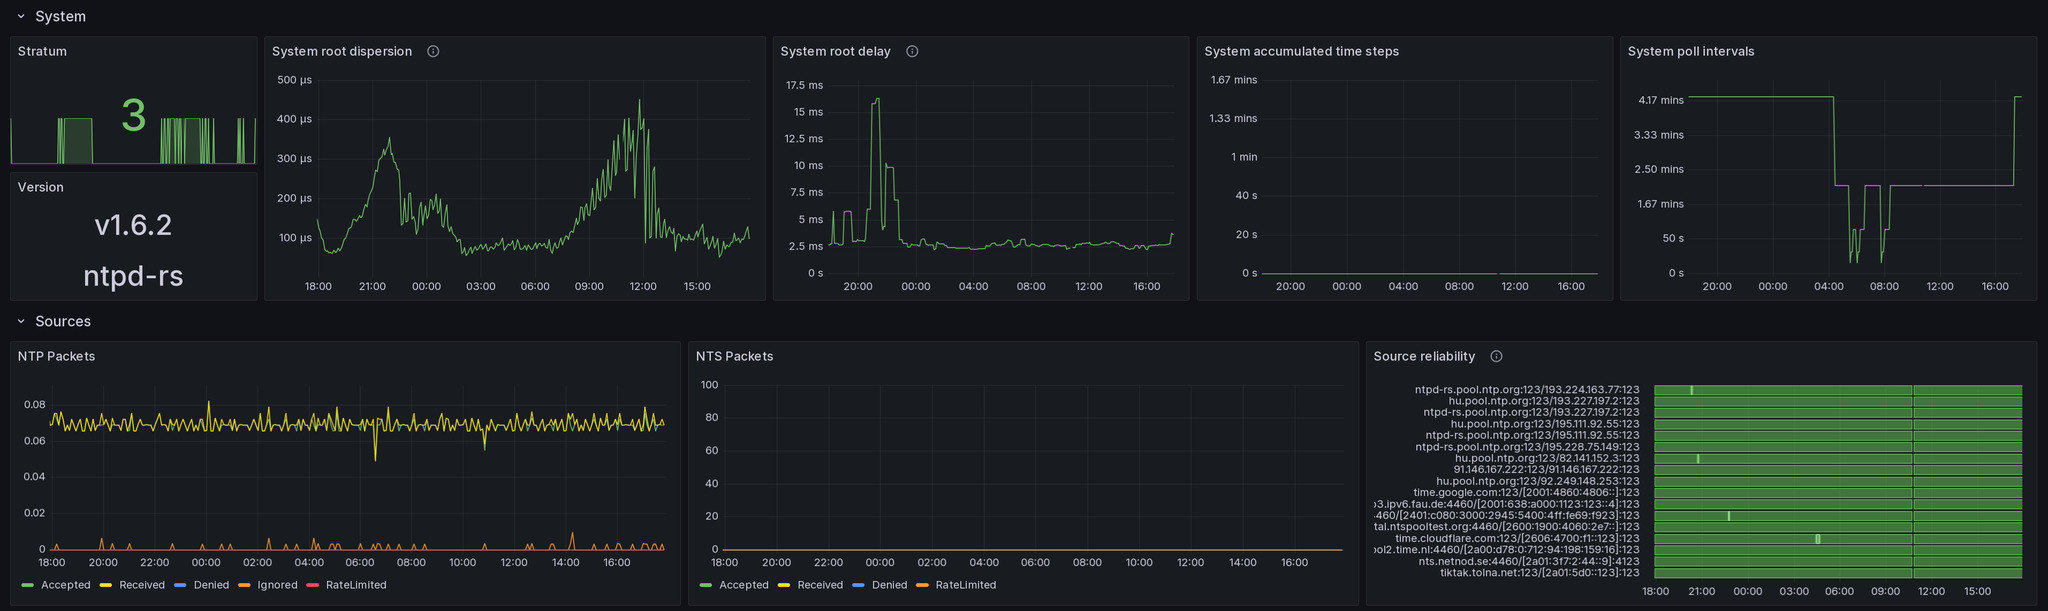
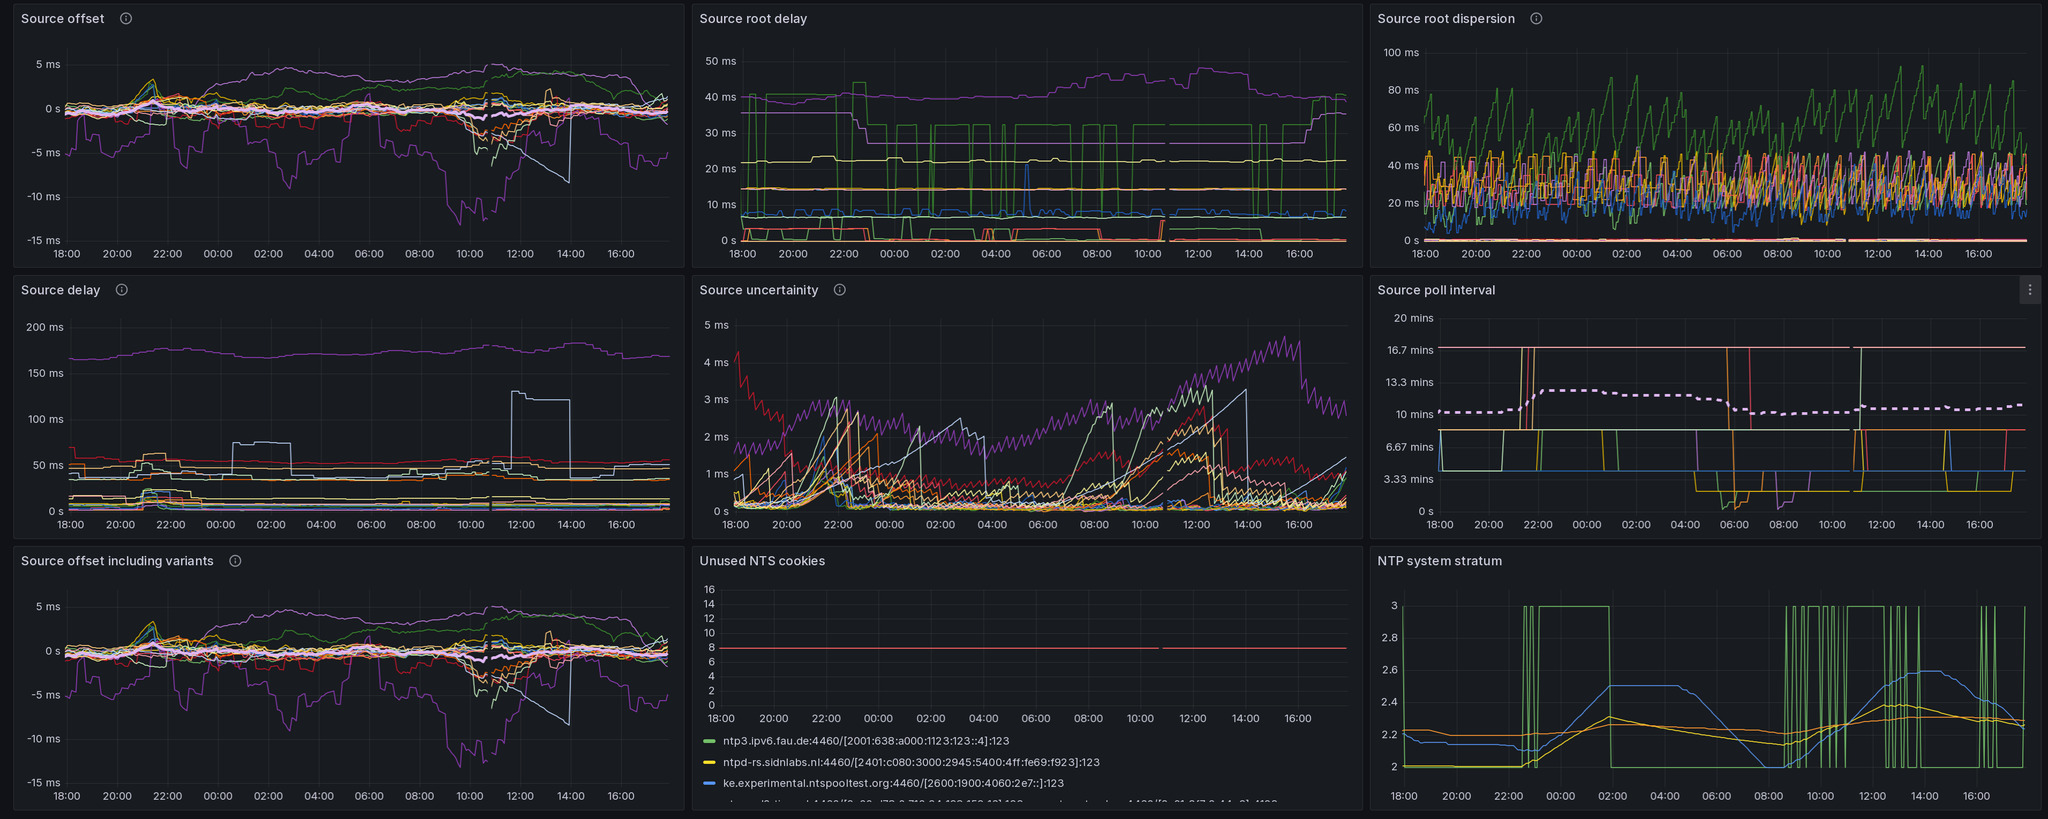
This dashboard tried to provide you a basic view for all the metrics ntpd-rs, the new and modern ntp dæmon written in Rust provides with its own metrics exporter.
It contains all variables exported at the moment of uploading this dashboard, or at least that's the hope.
My backend is Victoriametrics so you may need to insert a lot of superfluous time ranges, or replace rate with irate to make prometheus doing the right thing, if you chose to use that.
Data source config
Collector type:
Collector plugins:
Collector config:
Revisions
Upload an updated version of an exported dashboard.json file from Grafana
| Revision | Description | Created | |
|---|---|---|---|
| Download |