CloudWatch Logs Dashboard
CloudWatch Logs monitoring dashboard with log volume, error tracking, and search capabilities. Created and customized by Prajwal Adhikari.
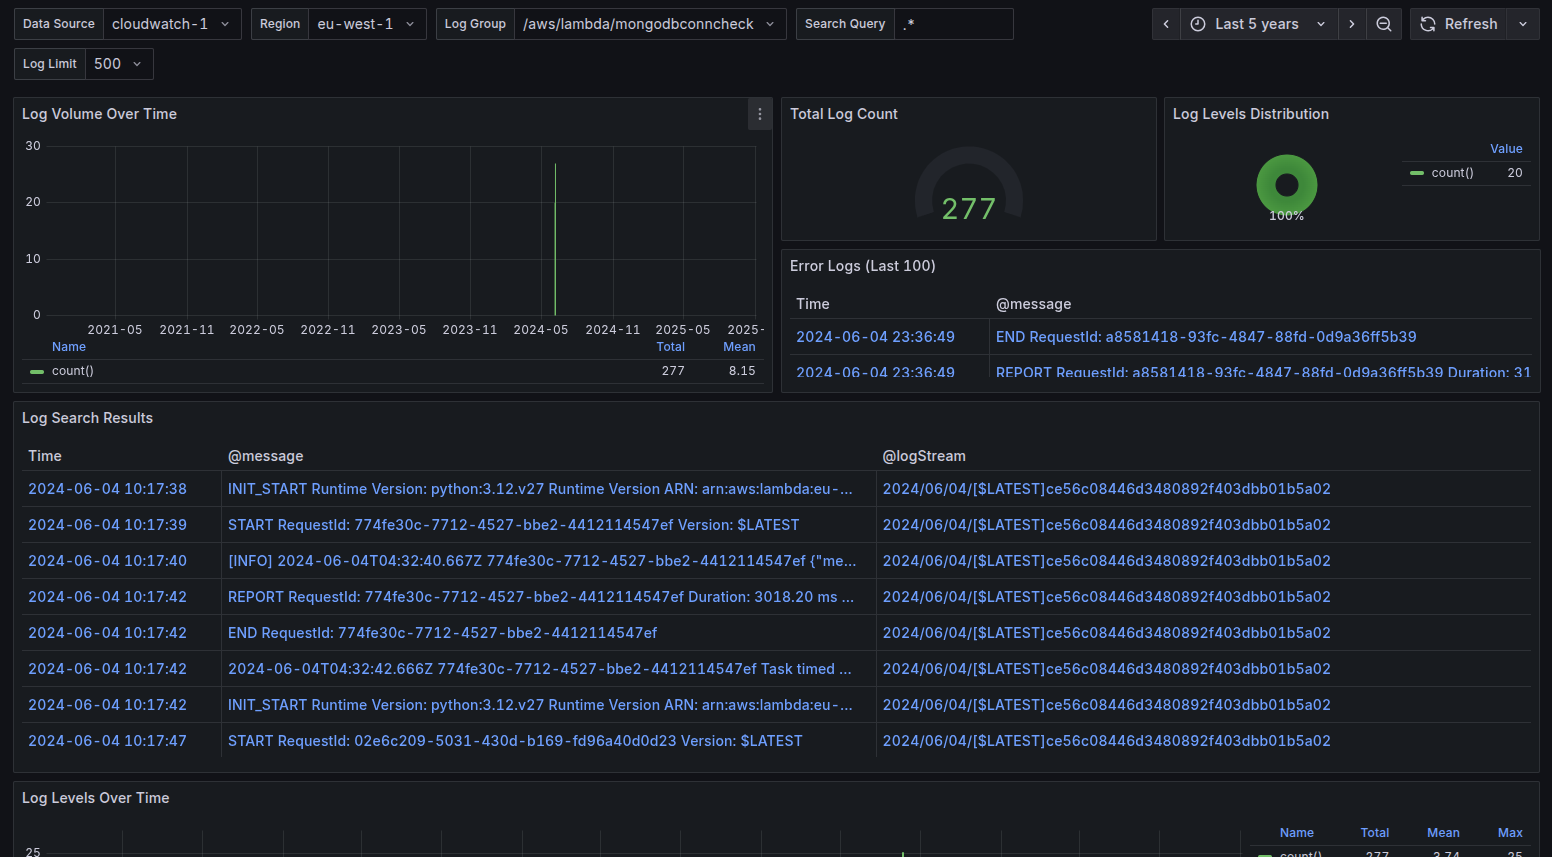
The CloudWatch Logs Dashboard dashboard uses the cloudwatch data source to create a Grafana dashboard with the graph, singlestat and table panels.
Data source config
Collector type:
Collector plugins:
Collector config:
Revisions
Upload an updated version of an exported dashboard.json file from Grafana
| Revision | Description | Created | |
|---|---|---|---|
| Download |
Grafana Loki (self-hosted)
Easily monitor Grafana Loki (self-hosted), a horizontally scalable, highly available, multi-tenant log aggregation system inspired by Prometheus, with Grafana Cloud's out-of-the-box monitoring solution.
Learn more