Vitiscale
Vitiscale storage cluster monitoring dashboard with CPU, memory, disk, and network metrics
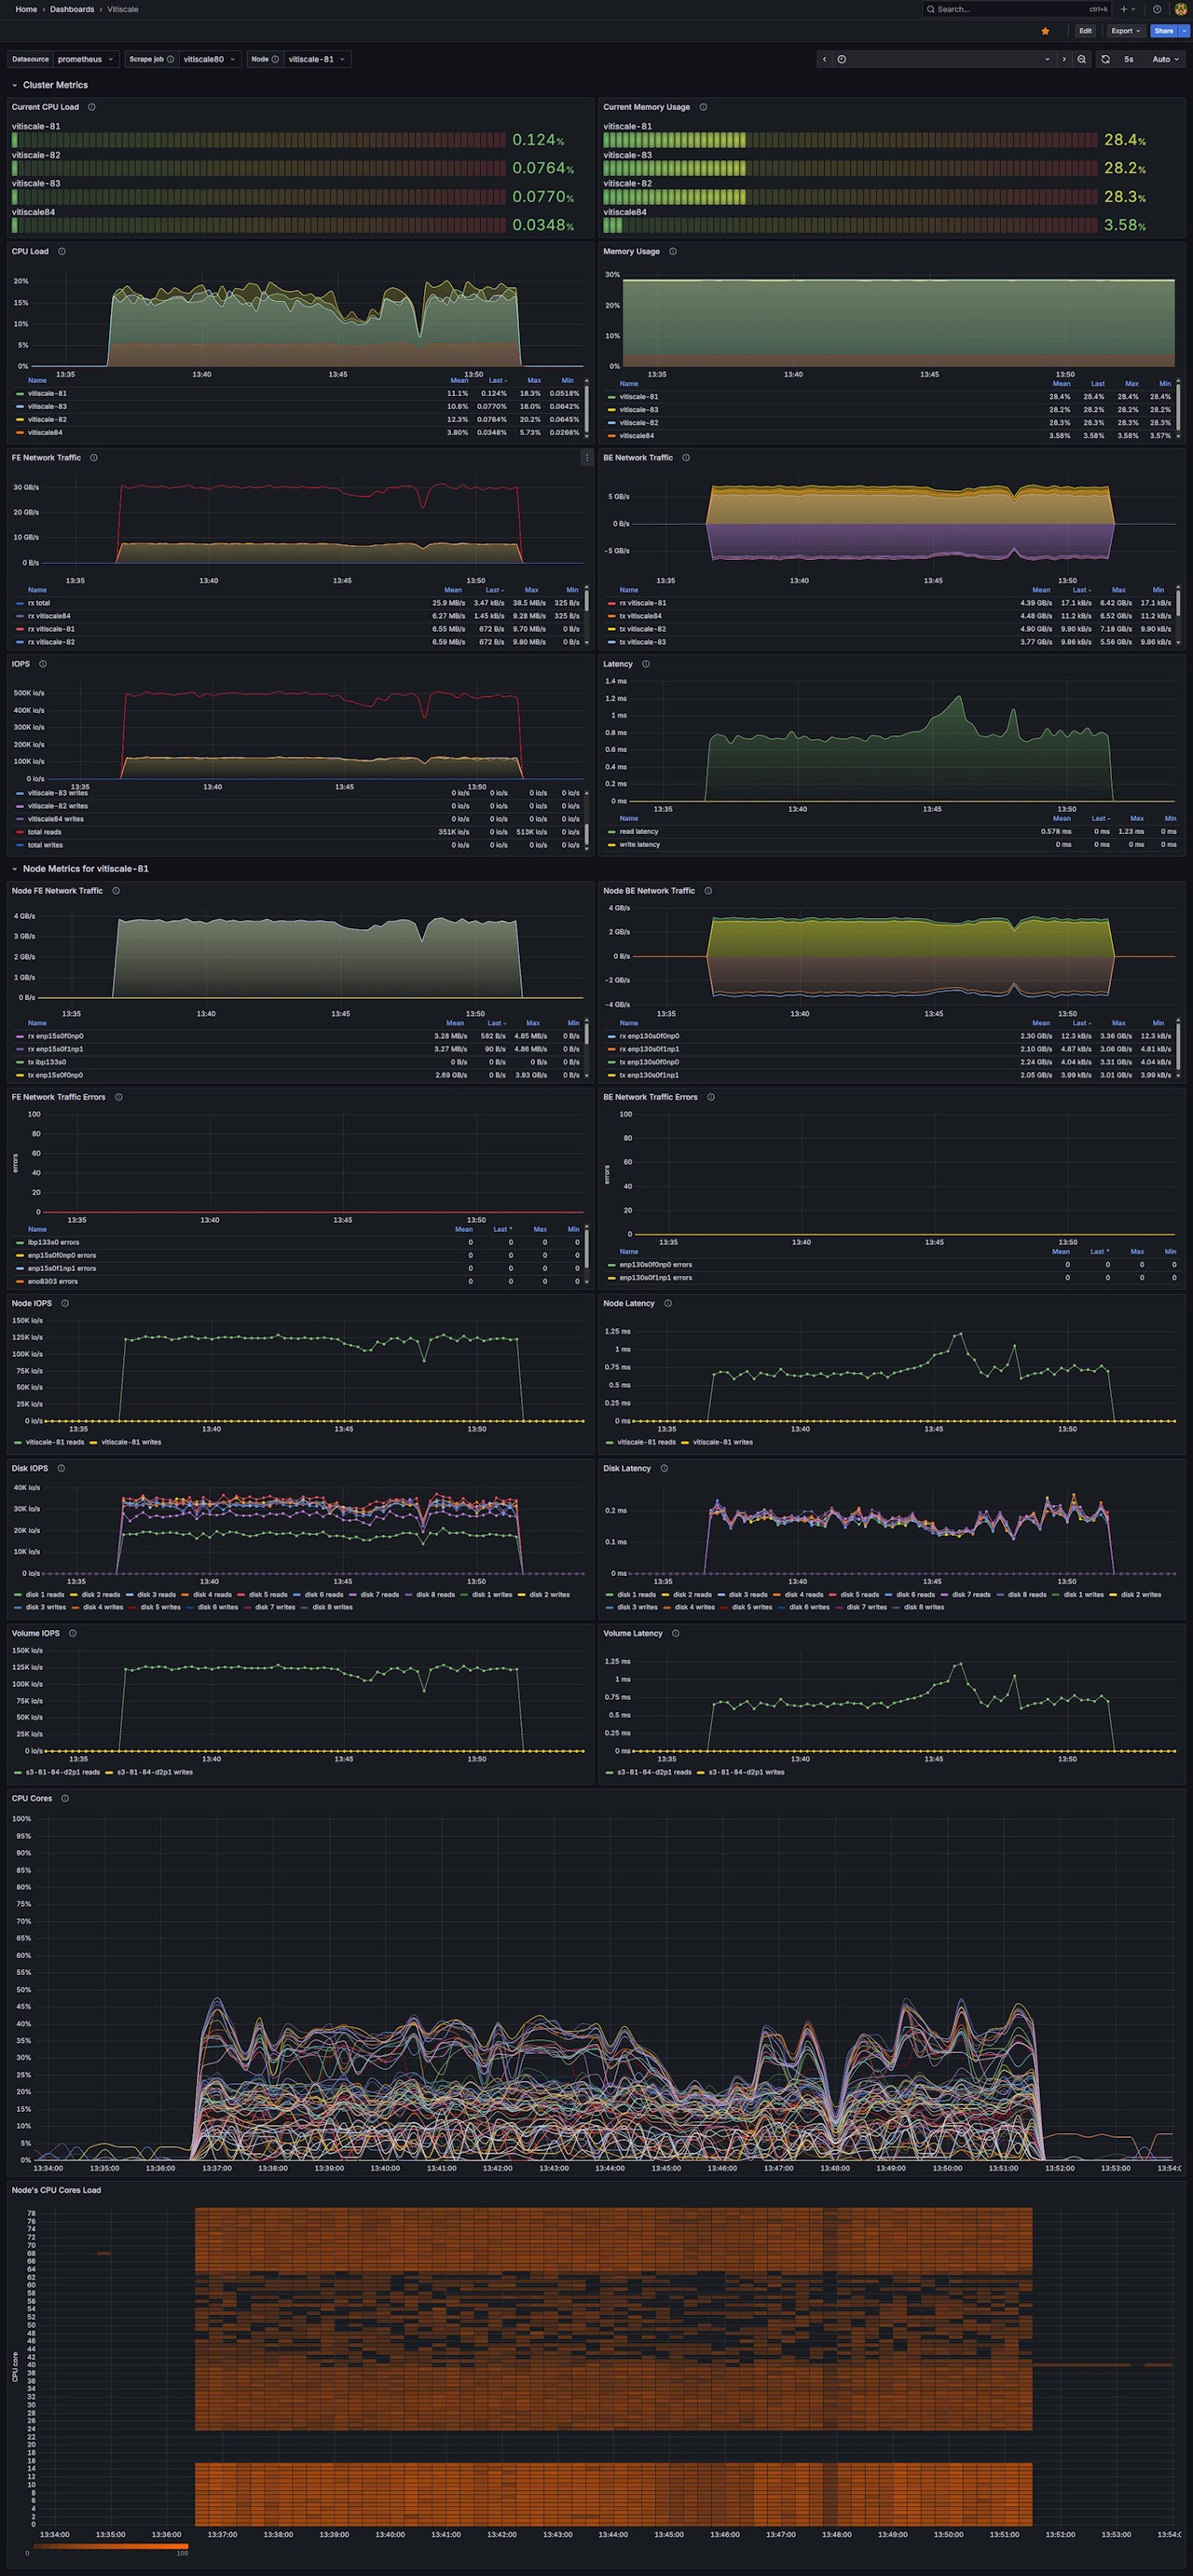
This dashboard uses Prometheus or a Prometheus-compatible data source that retrieves metrics directly from a vitiscale storage system via a built-in exporter available on the cluser management ip.
Data source config
Collector type:
Collector plugins:
Collector config:
Revisions
Upload an updated version of an exported dashboard.json file from Grafana
| Revision | Description | Created | |
|---|---|---|---|
| Download |