PostgreSQL Monitoring Dashboard
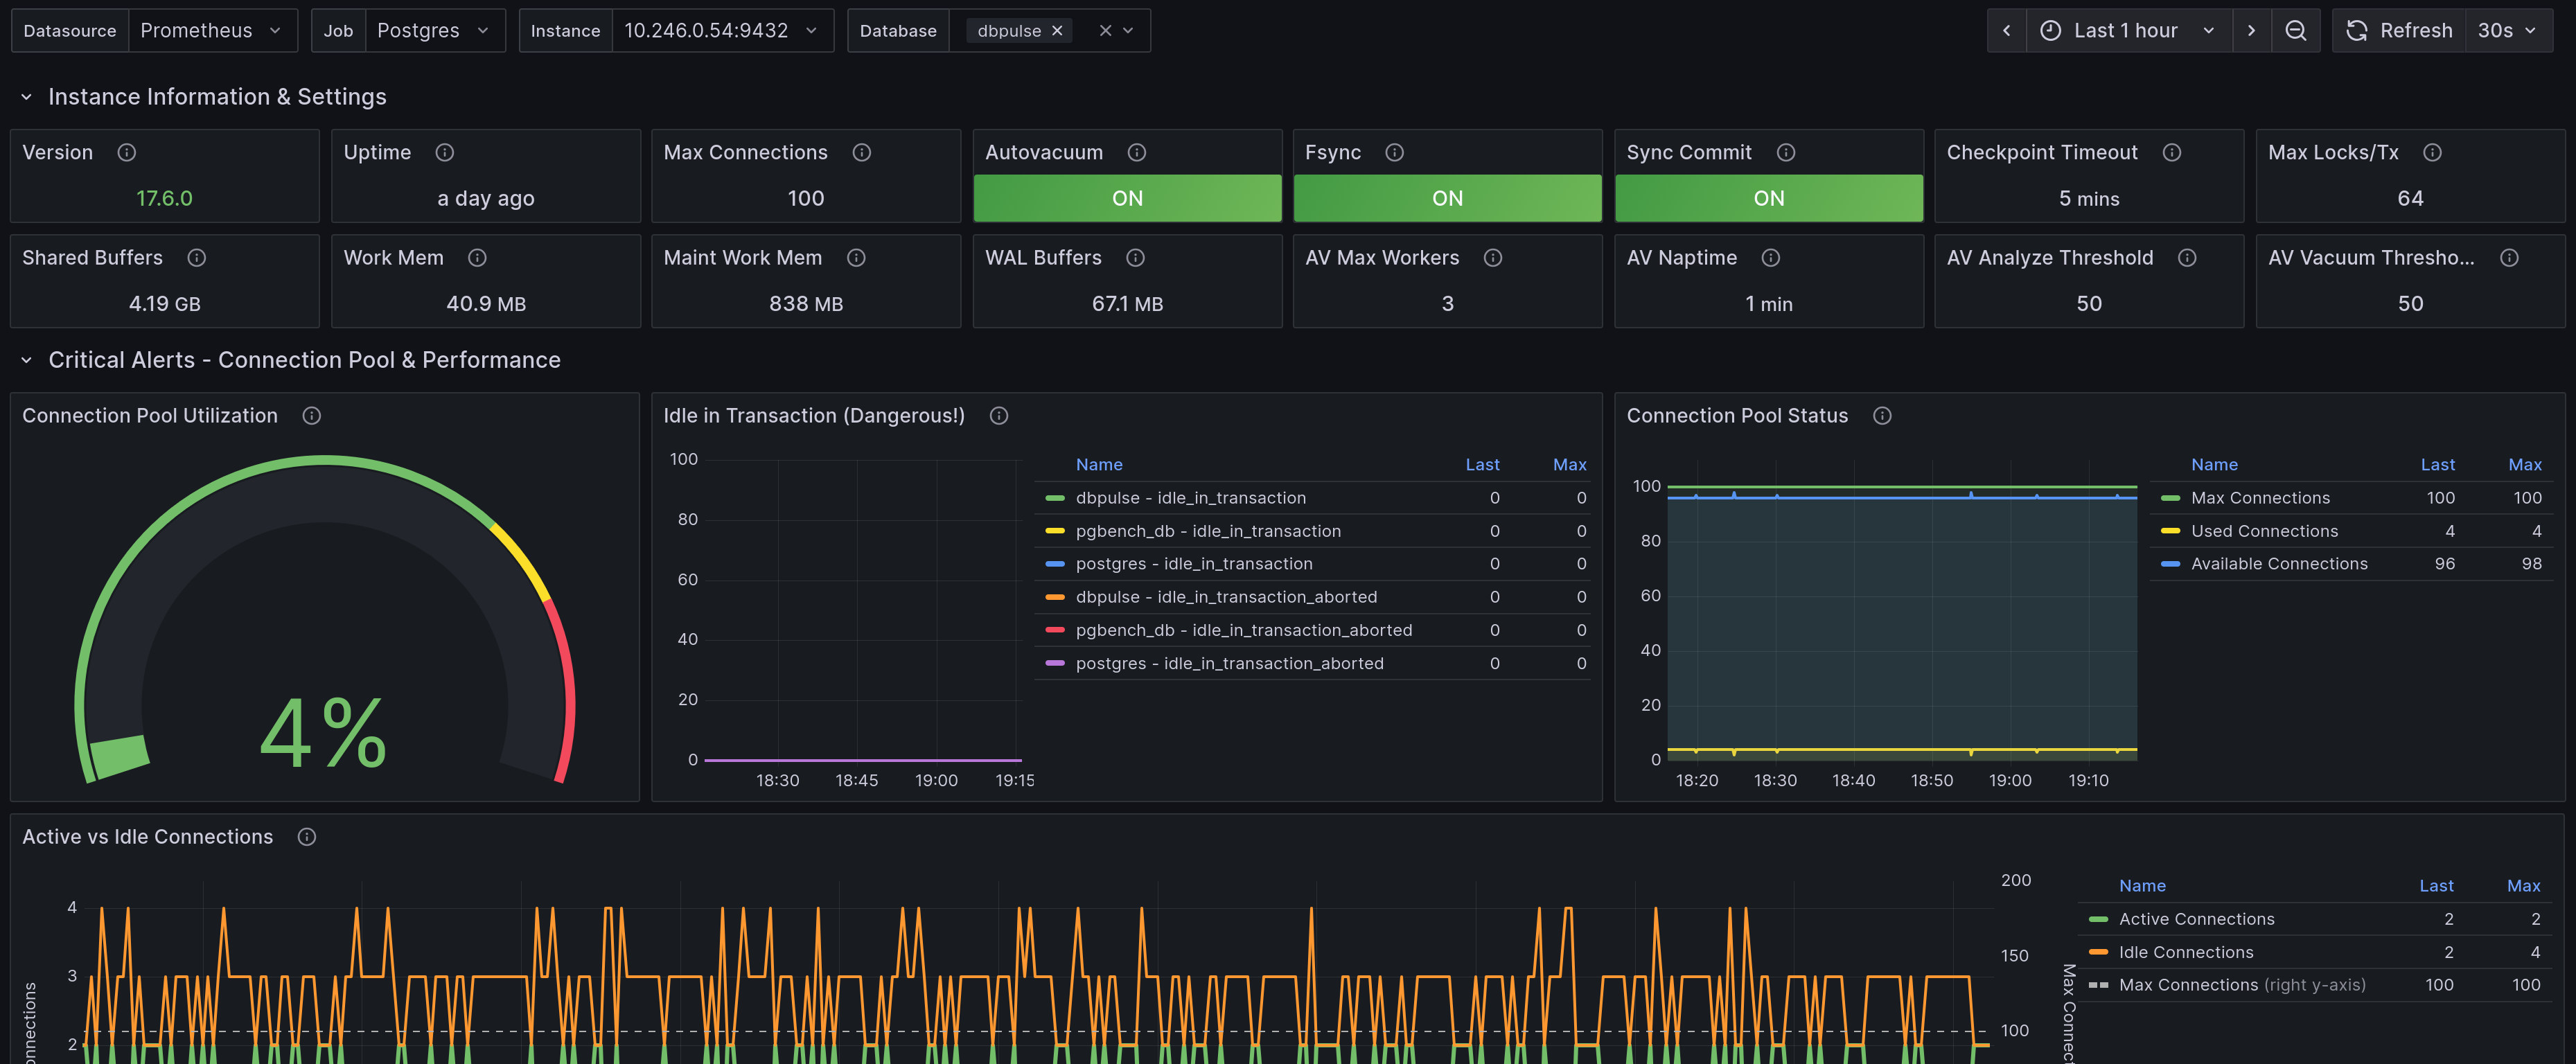
PostgreSQL Performance Monitoring Dashboard This dashboard provides comprehensive monitoring for PostgreSQL databases using pg_exporter metrics. KEY SECTIONS: - Instance Information: PostgreSQL version, settings, and uptime - Critical Alerts: Connection pool utilization and performance warnings - Connection Analysis: Active connections, idle transactions, and connection age - Query Performance: Top queries by execution time, calls, and I/O (requires pg_stat_statements extension) - Cache & I/O: Buffer cache hit ratios, shared buffers, and I/O operations - Locks & Blocking: Lock monitoring and blocking query detection - Vacuum & Maintenance: Autovacuum activity, table bloat, and maintenance statistics - WAL: WAL throughput, record activity, buffer pressure, and FPI ratio - Replication: lag, role, and max replication lag bytes (requires replication collector) - Table Statistics: DML operations and table-level activity - Database Size: Database growth and size trends REQUIREMENTS: - PostgreSQL 14+ - pg_stat_statements extension enabled for query performance metrics - Appropriate monitoring user permissions For more information, visit: https://github.com/nbari/pg_exporter
pg_exporter \
    --collector.locks \
    --collector.database \
    --collector.stat \
    --collector.replication \
    --collector.index \
    --collector.statements \
    --collector.tls \
    --collector.exporter
For more information: https://github.com/nbari/pg_exporter/tree/main/grafana
Data source config
Collector config:
Upload an updated version of an exported dashboard.json file from Grafana
| Revision | Description | Created | |
|---|---|---|---|
| Download |
PostgreSQL
Easily monitor your deployment of PostgreSQL, the open source relational database, with Grafana Cloud's out-of-the-box monitoring solution.
Learn more