Business Observability - North Star Metrics
Business observability dashboard tracking North Star metrics and key business KPIs. Monitor user engagement, conversion rates, revenue trends, and customer retention. Correlate business outcomes with technical performance to understand the full impact of system health.
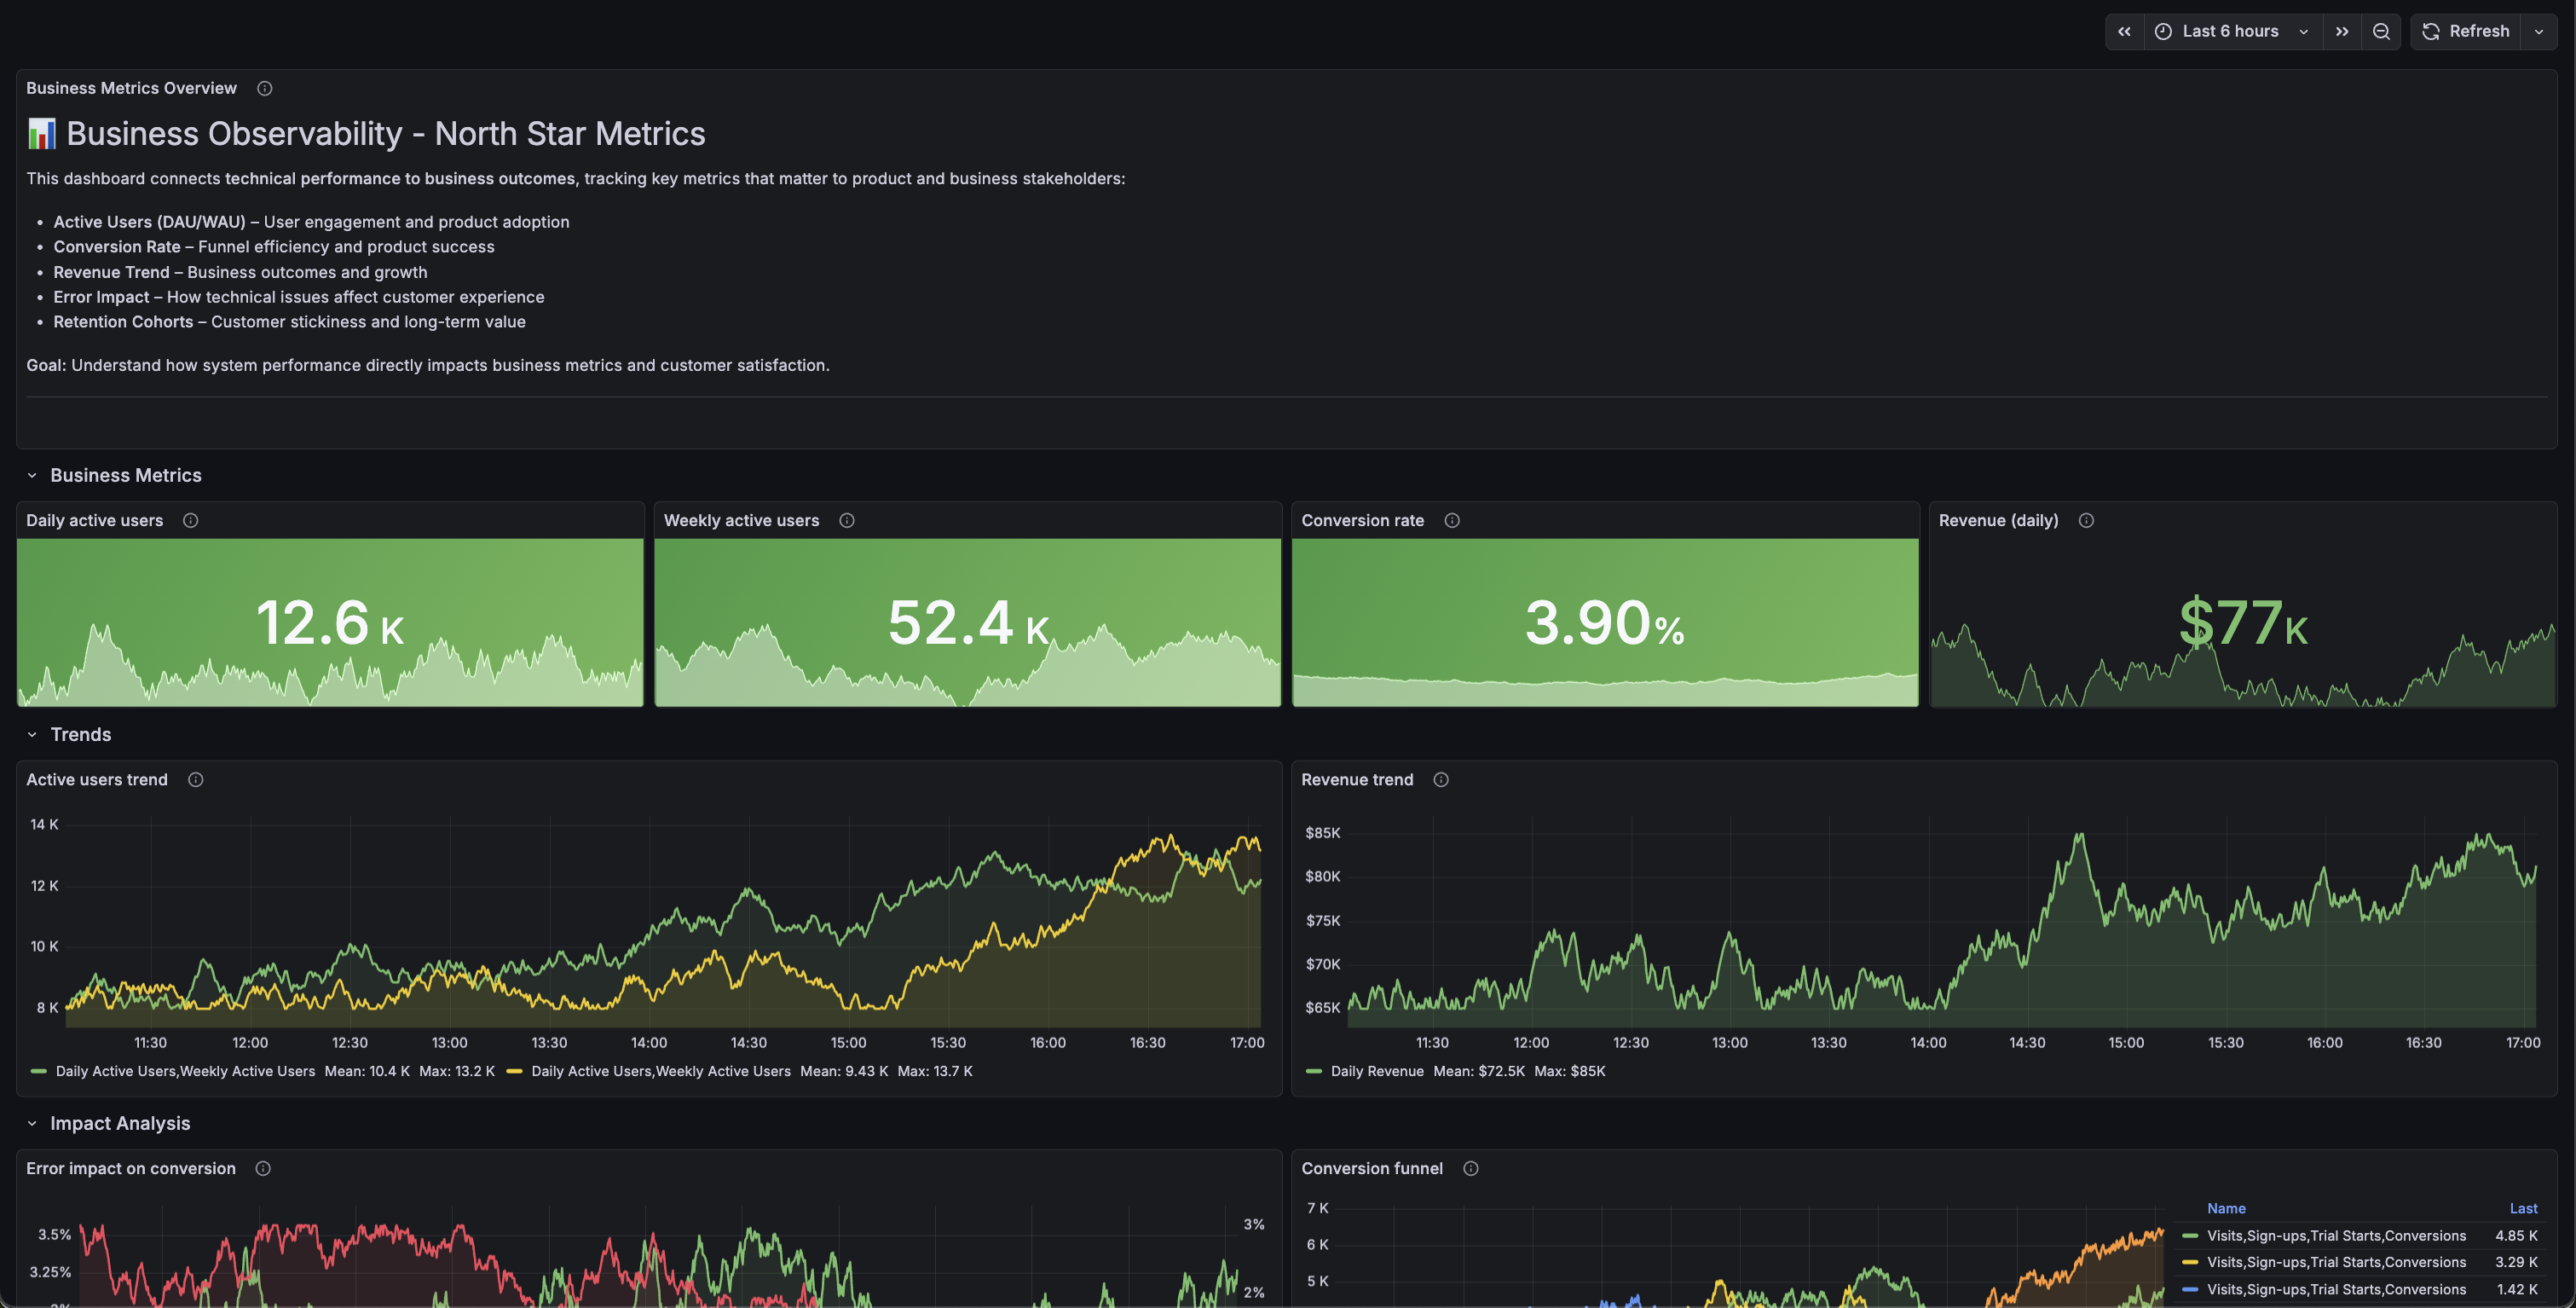
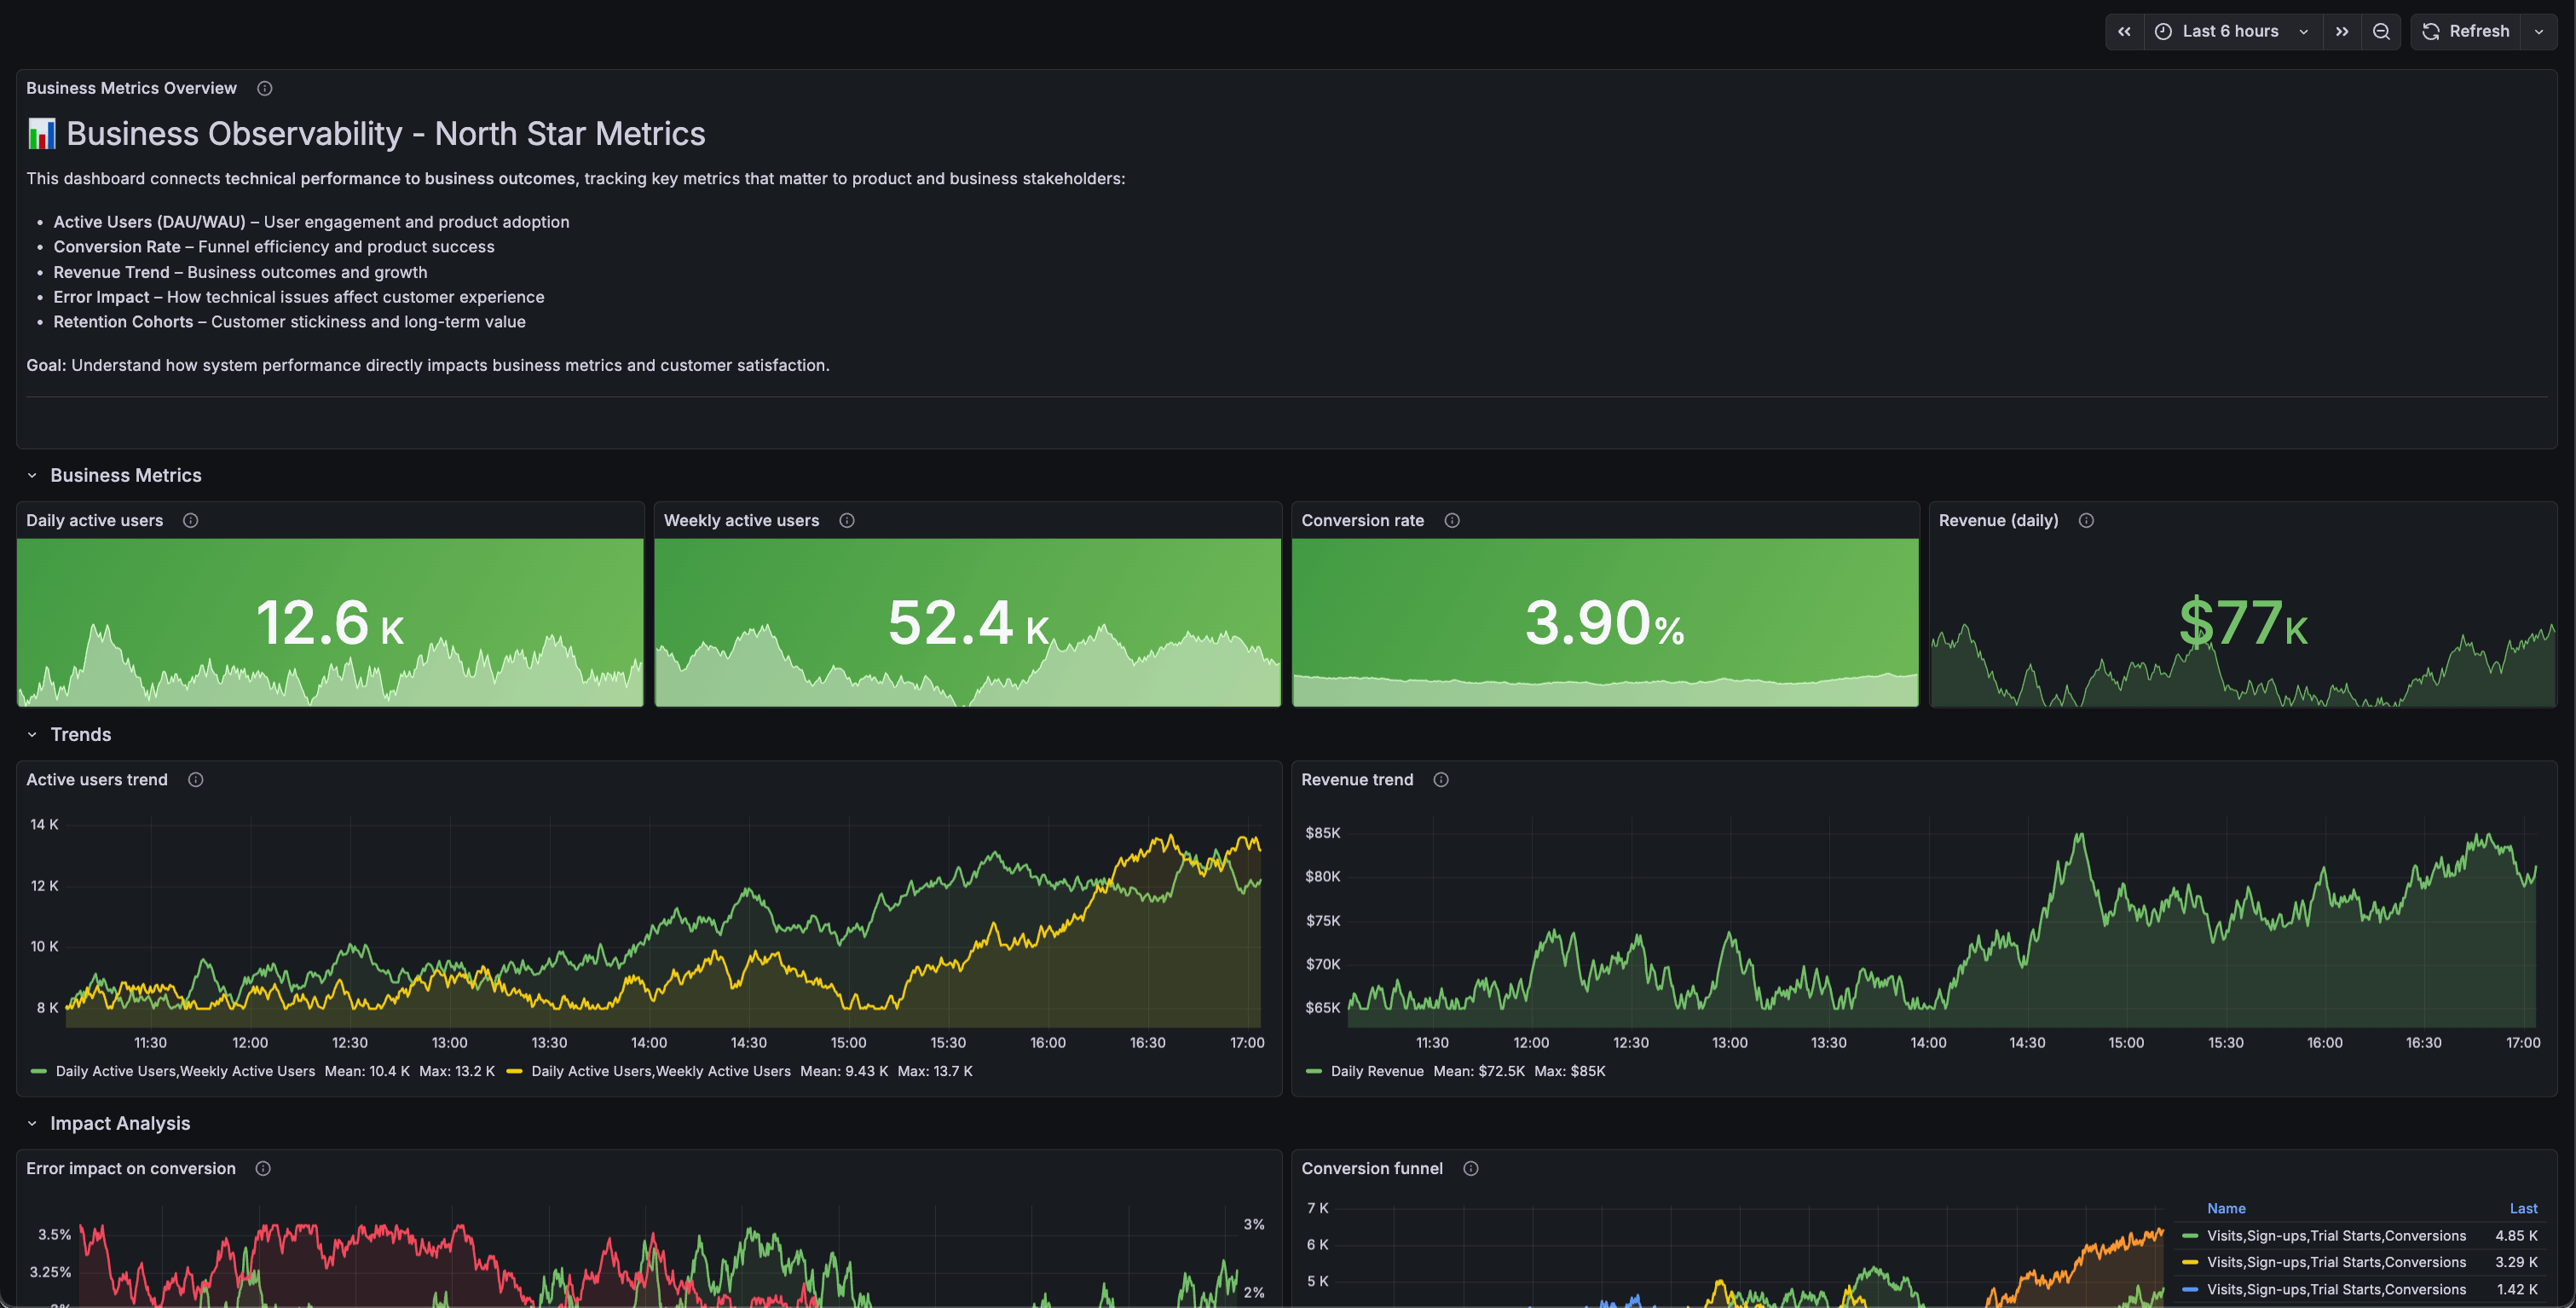
The Business Observability - North Star Metrics dashboard uses the grafana-testdata-datasource data source to create a Grafana dashboard with the stat, table, text and timeseries panels.
Data source config
Collector type:
Collector plugins:
Collector config:
Revisions
Upload an updated version of an exported dashboard.json file from Grafana
| Revision | Description | Created | |
|---|---|---|---|
| Download |