Nebius Observability Platform
Unified overview of Nebius Observability usage. https://docs.nebius.com/observability
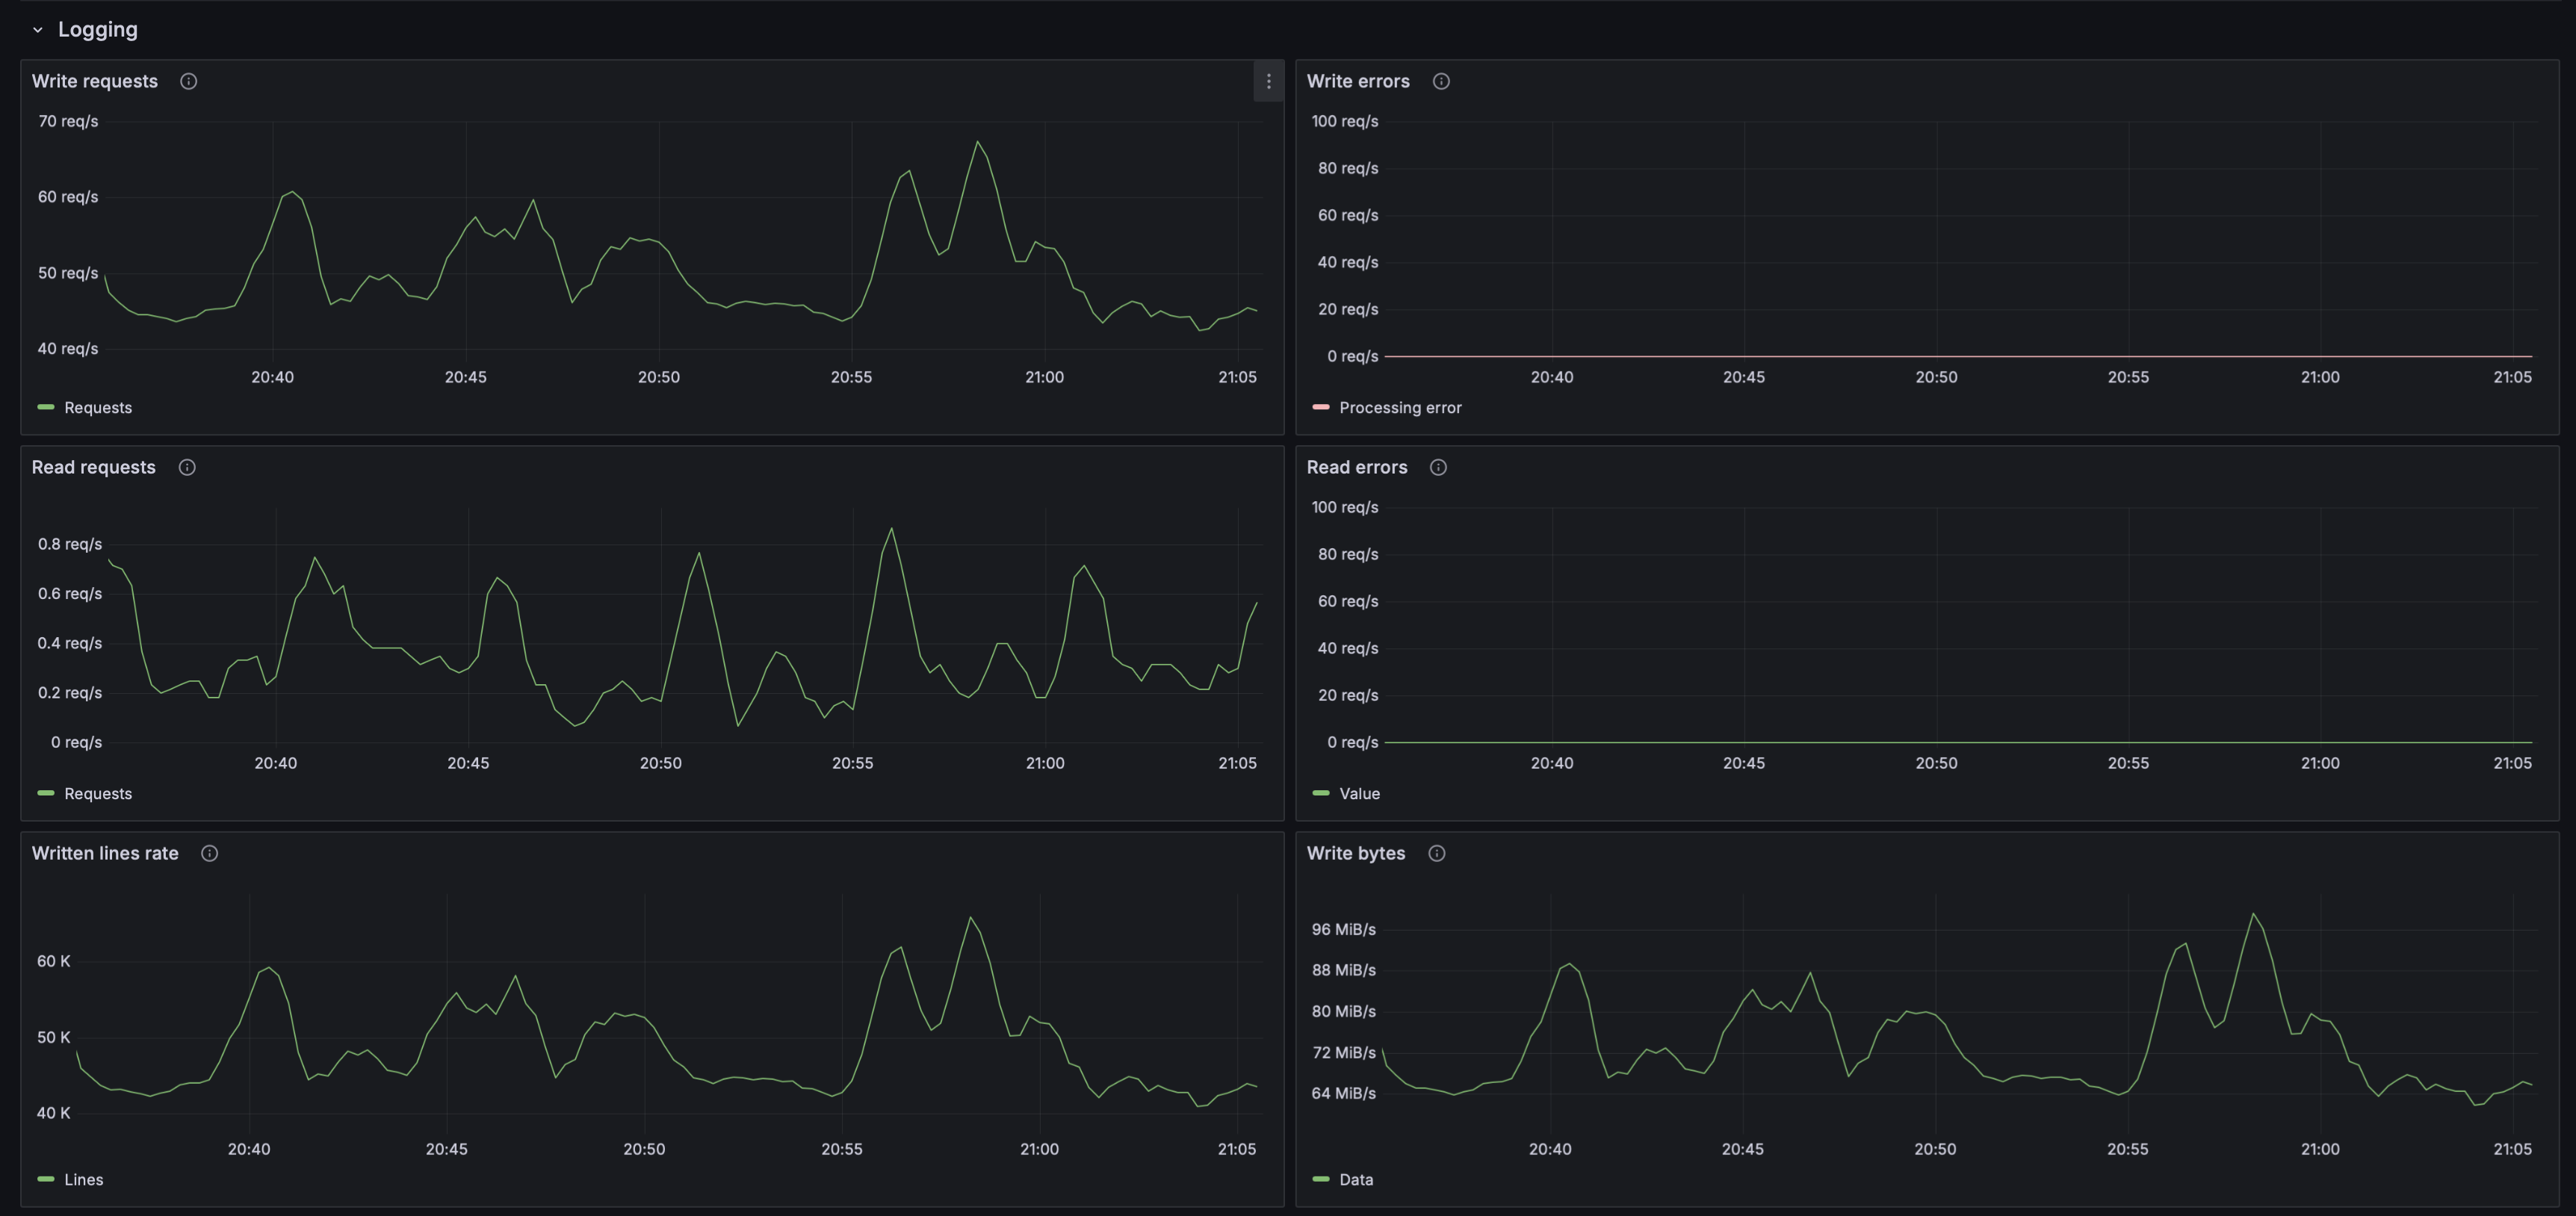
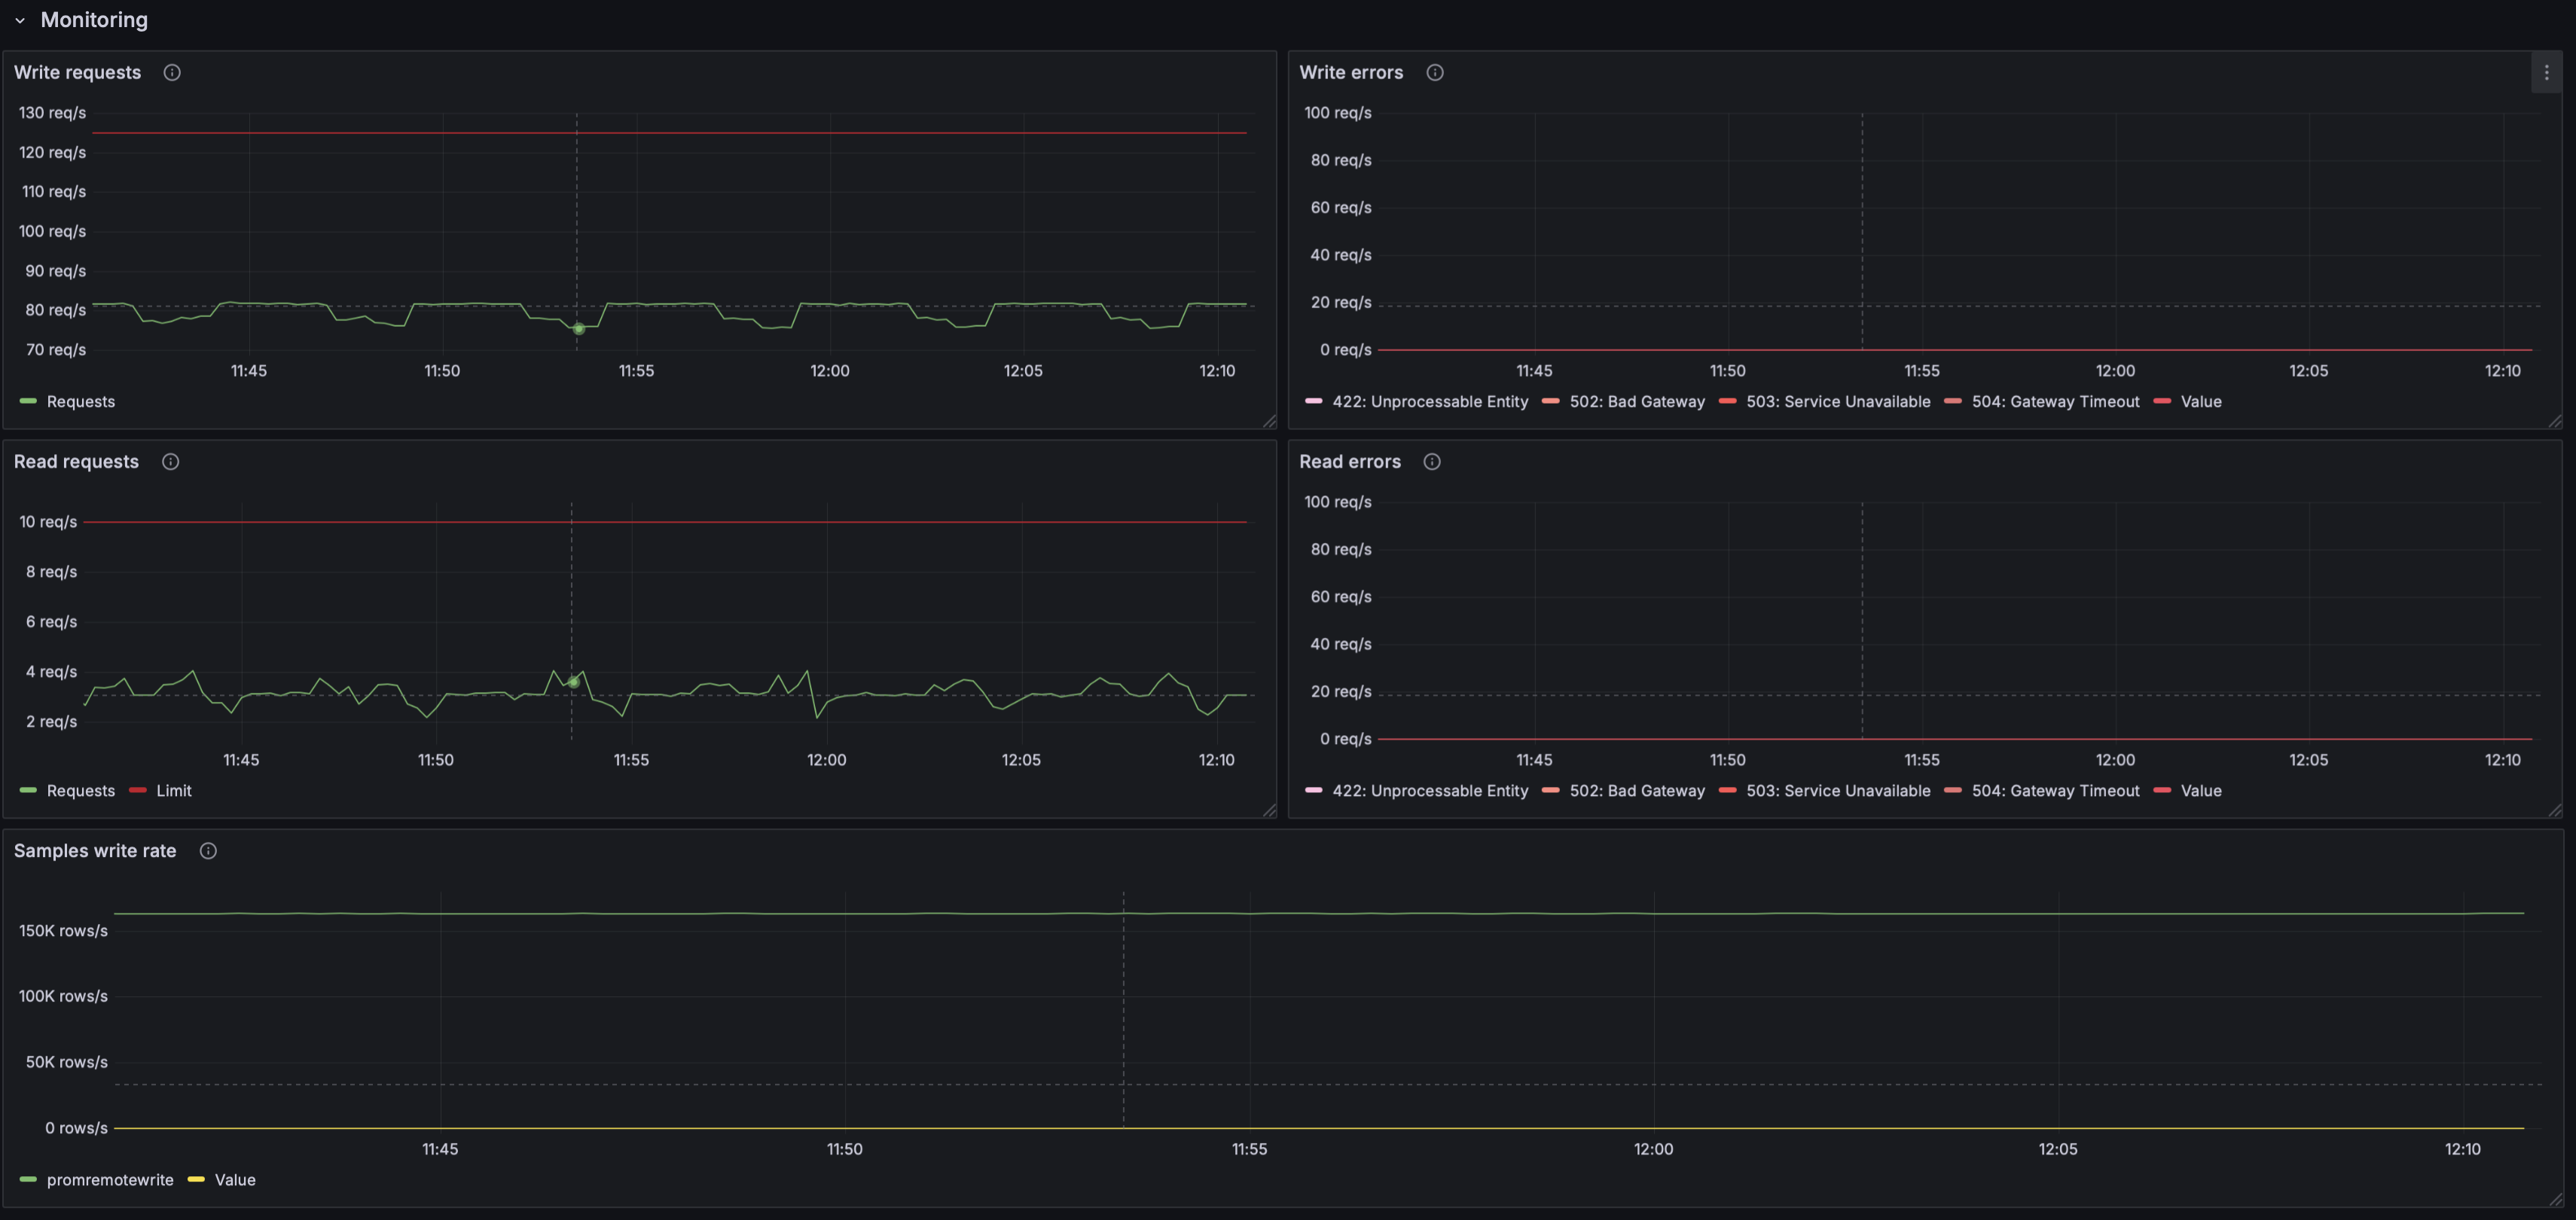
This dashboard provides comprehensive monitoring and visualization of Nebius Observability, covering both Monitoring (metrics) and Logging. It highlights write/read throughput, error rates, ingestion volumes (lines/bytes), and latency percentiles for quick triage and capacity insights. A detailed description of all panels and metrics is available in our documentation: https://docs.nebius.com/observability
Data source config
Collector type:
Collector plugins:
Collector config:
Revisions
Upload an updated version of an exported dashboard.json file from Grafana
| Revision | Description | Created | |
|---|---|---|---|
| Download |