Azure Container Storage v2
The dashboard can be used to display the metrics for the local CSI driver and ESAN CSI driver (Will be added soon). The dashboard displays the data plane metrics of the volumes in the cluster.
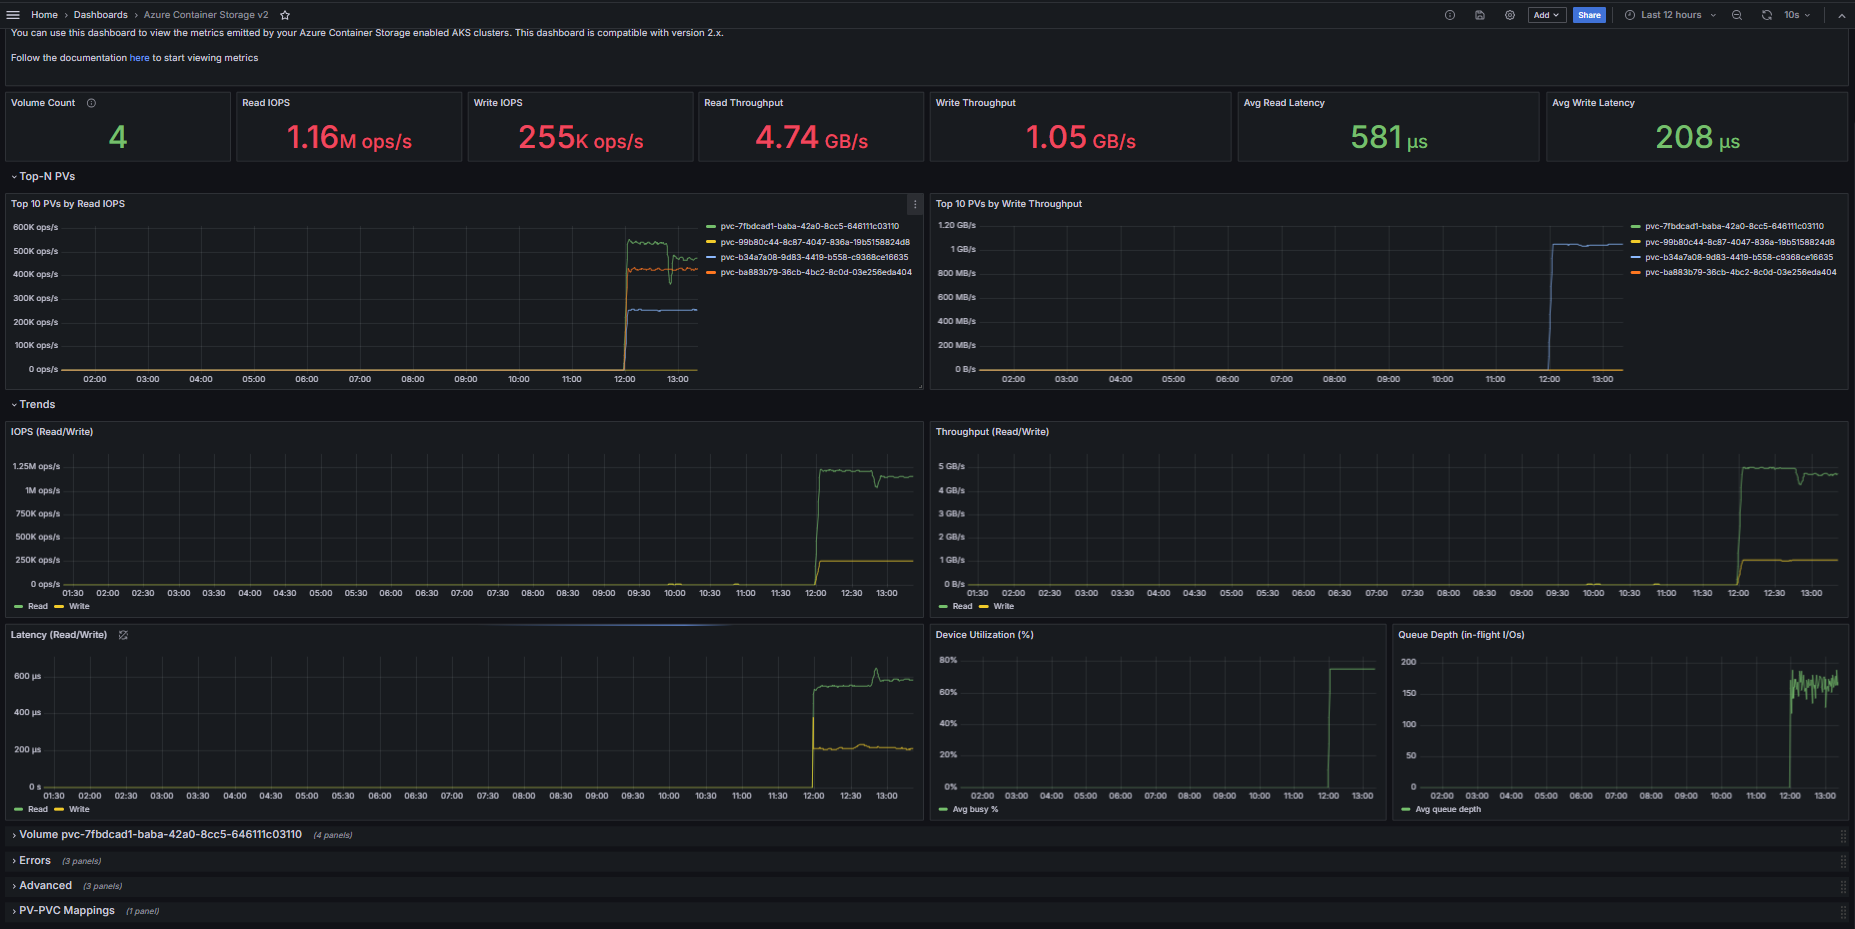
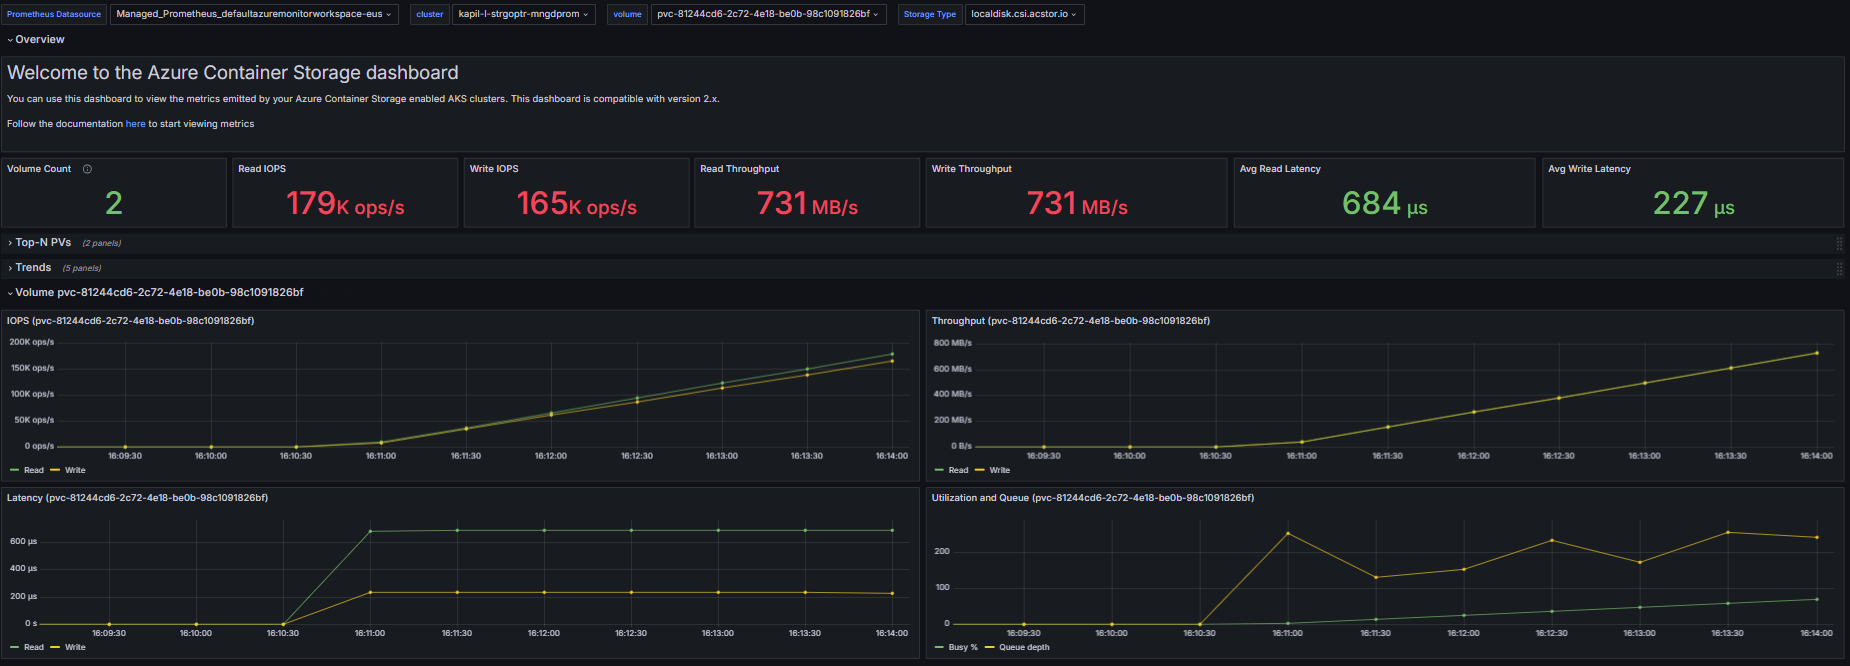
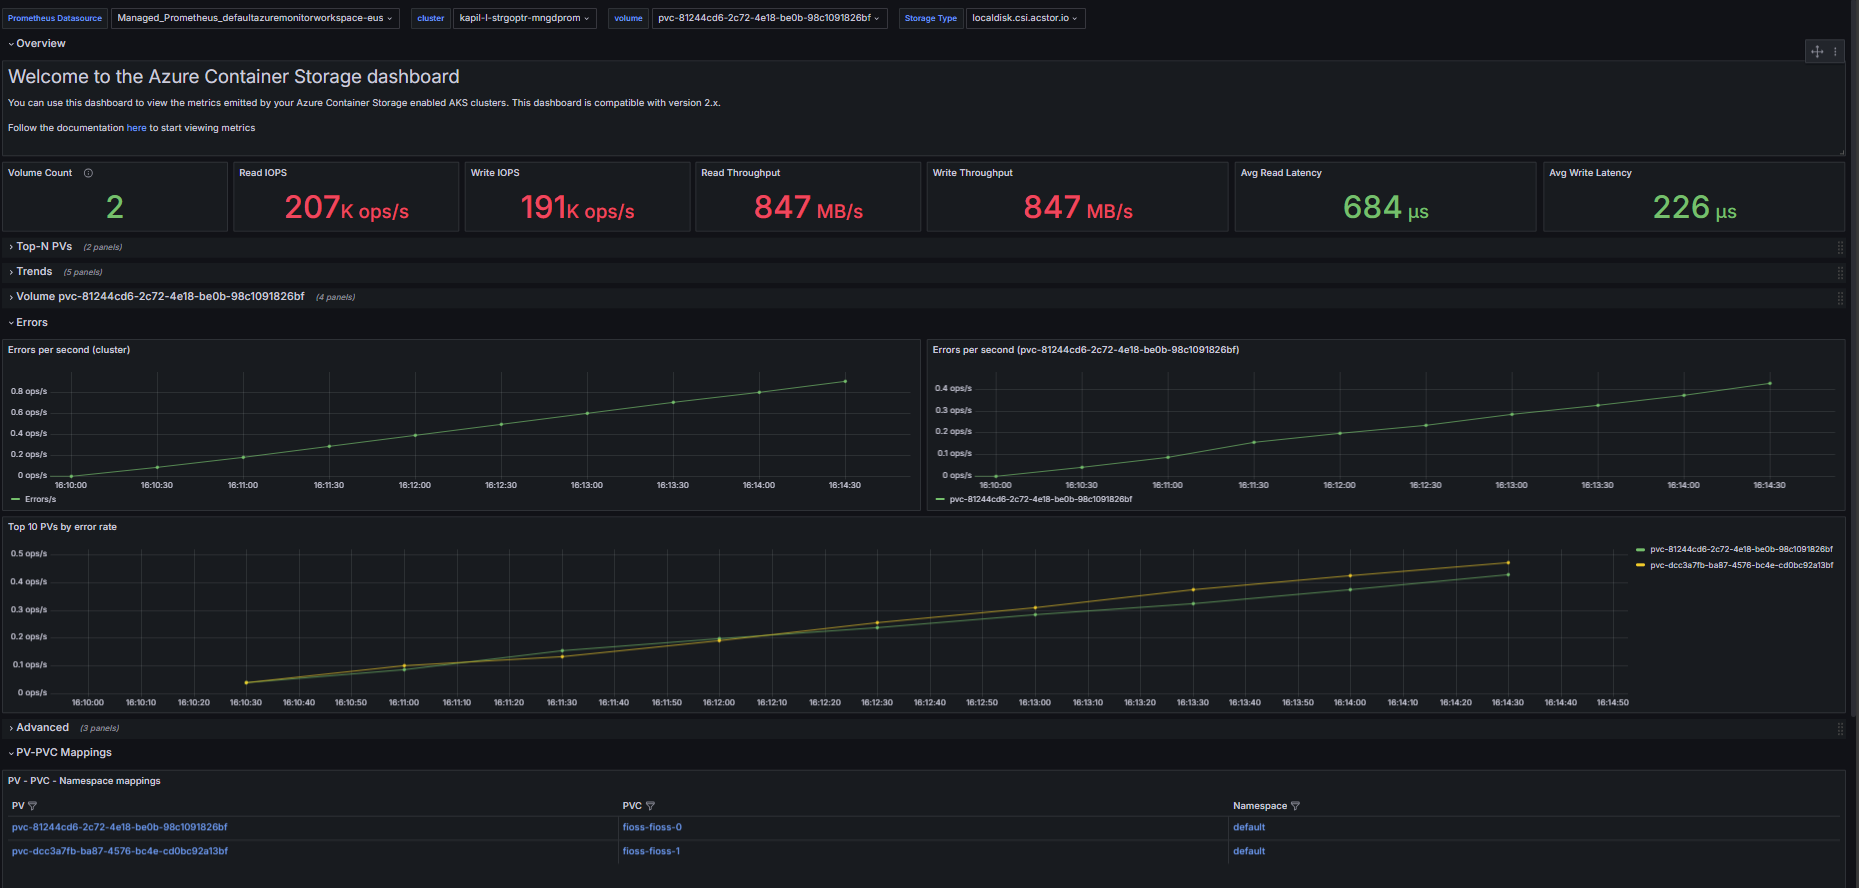
The Azure Container Storage v2 dashboard uses the prometheus data source to create a Grafana dashboard with the stat, table, text and timeseries panels.
Data source config
Collector type:
Collector plugins:
Collector config:
Revisions
Upload an updated version of an exported dashboard.json file from Grafana
| Revision | Description | Created | |
|---|---|---|---|
| Download |
Azure Cosmos DB
With the Grafana plugin for Azure Cosmos DB, you can quickly visualize and query your Azure Cosmos DB data from within Grafana.
Learn more