HPC / Combined Node, IB, GPU (profiling included) & NVLink Metrics Dashboard
This dashboard monitors HPC nodes with extended GPU profiling metrics including SM activity, tensor core usage, FP16/32/64 pipeline utilization, plus InfiniBand and NVLink performance data.
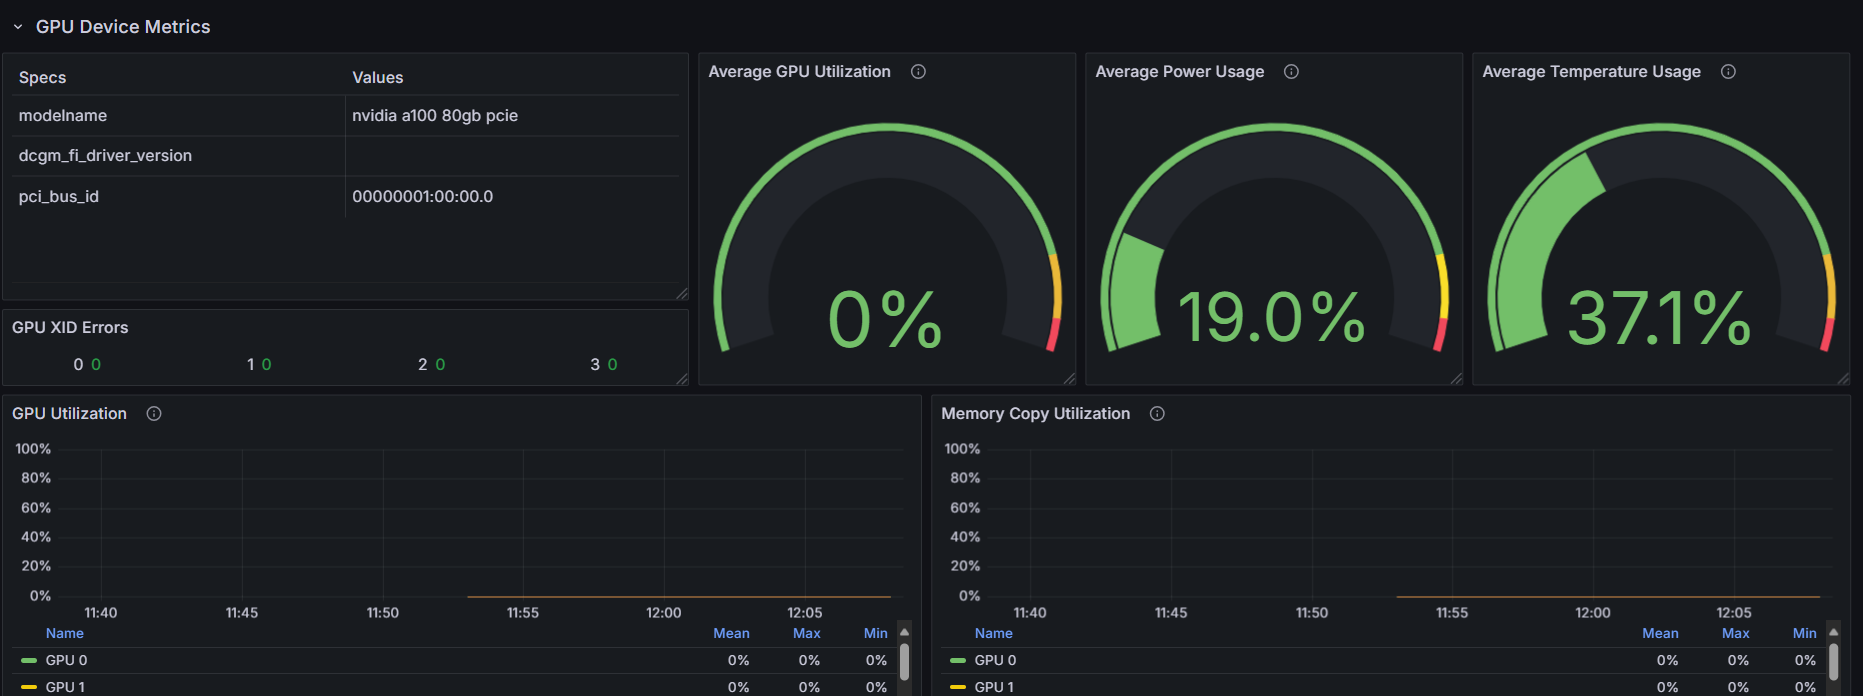
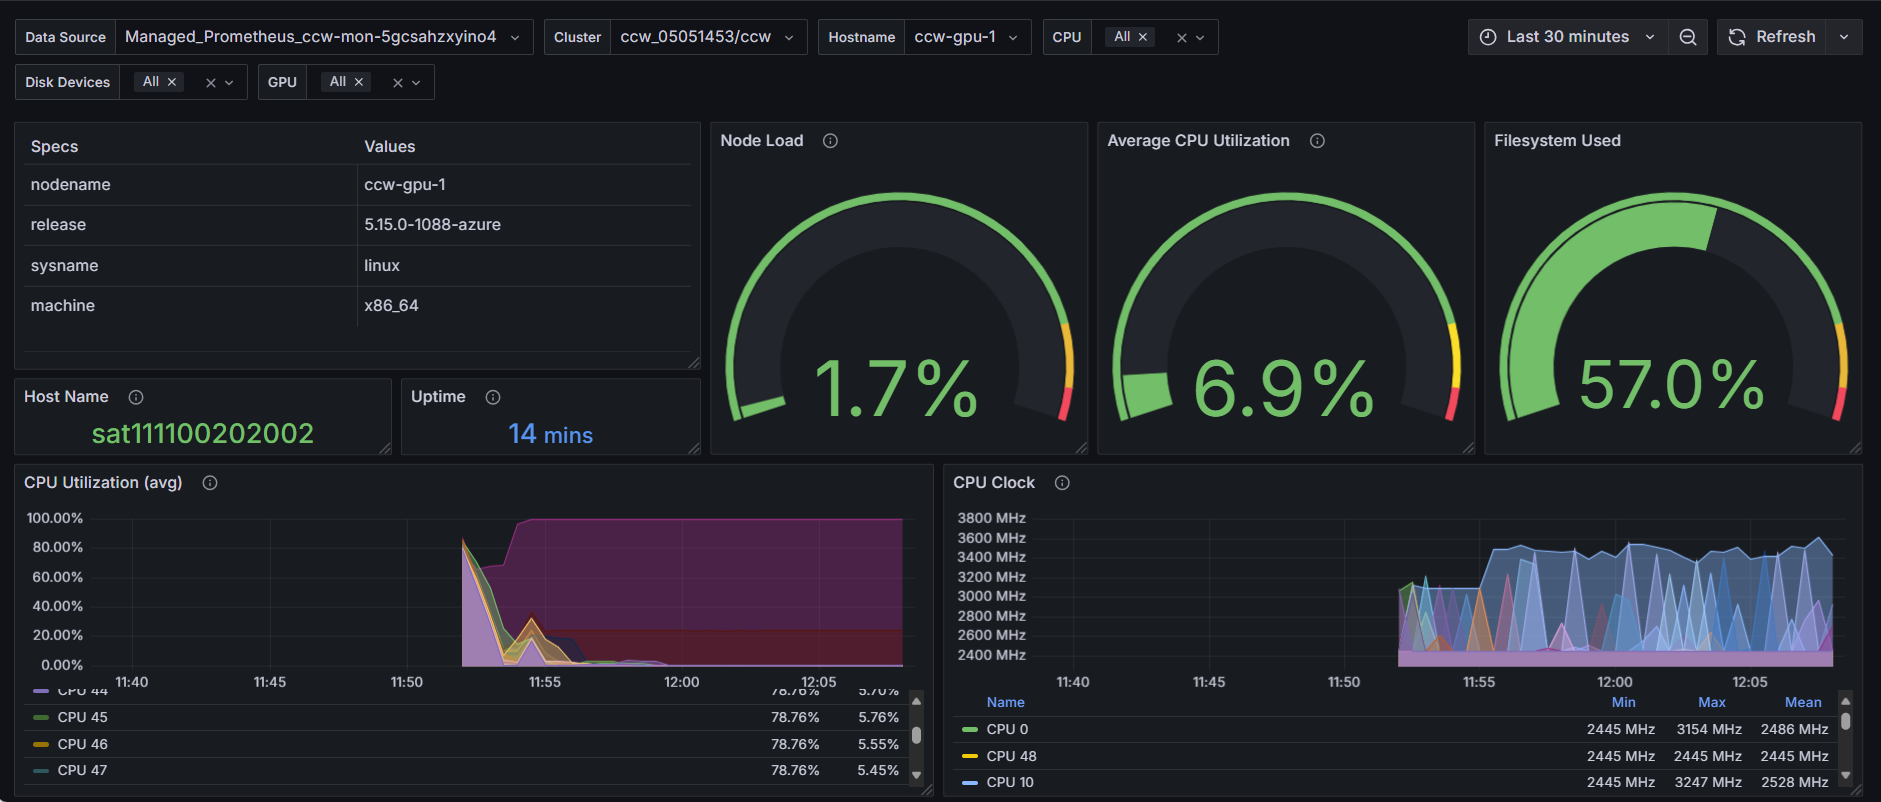
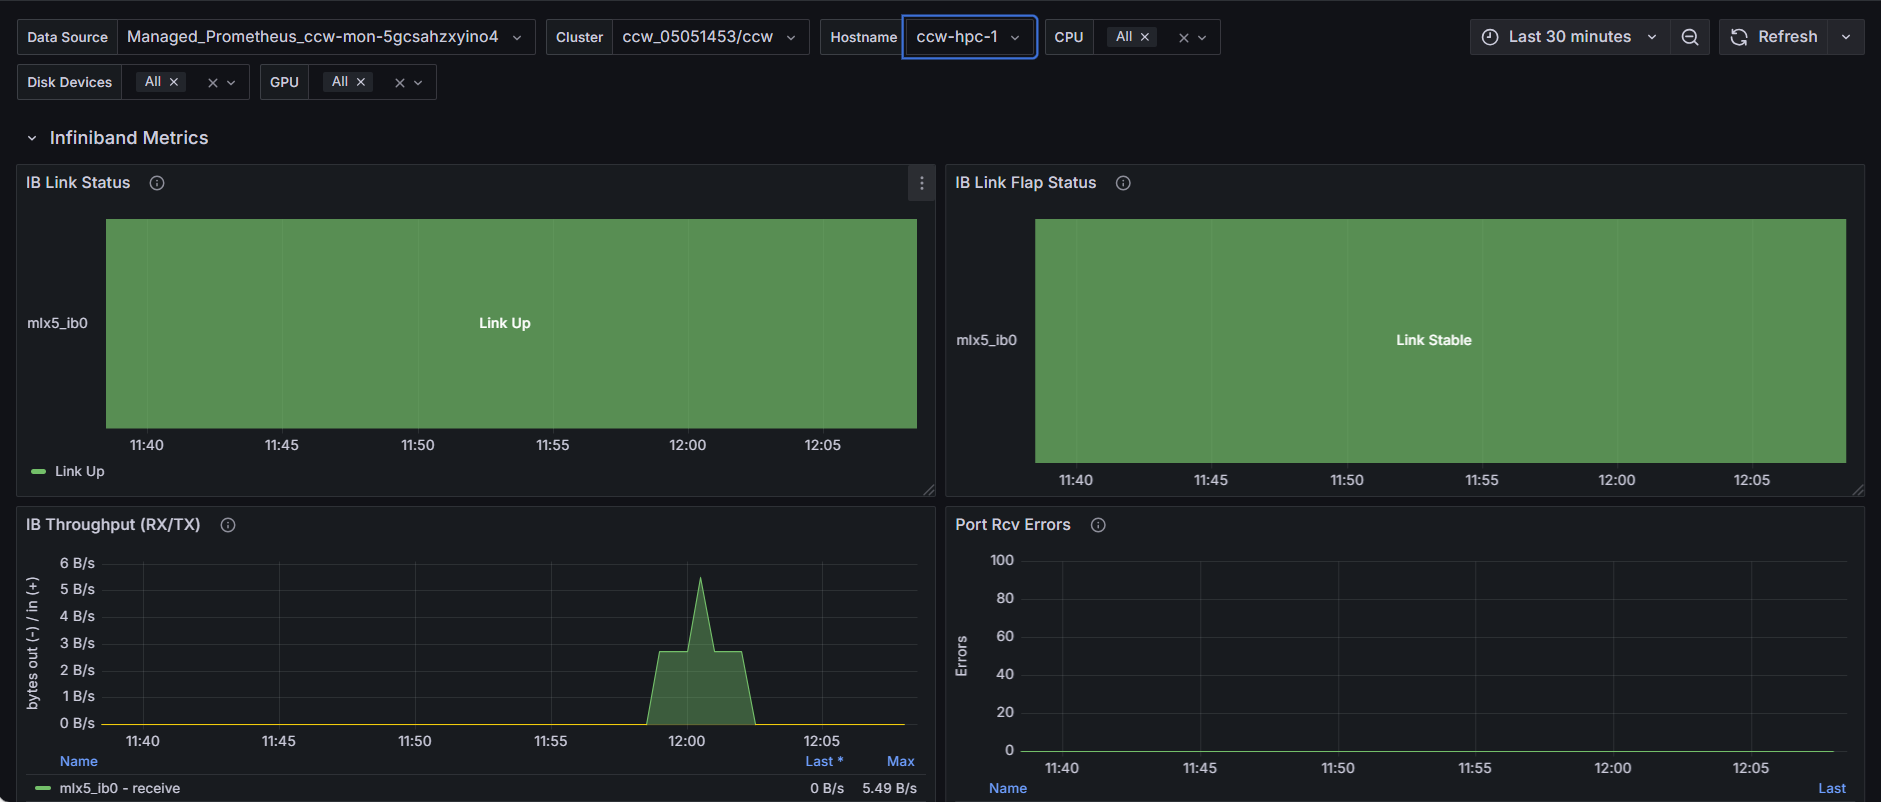
The HPC / Combined Node, IB, GPU (profiling included) & NVLink Metrics Dashboard dashboard uses the prometheus data source to create a Grafana dashboard with the gauge, stat, state-timeline, table, text and timeseries panels.
Data source config
Collector type:
Collector plugins:
Collector config:
Revisions
Upload an updated version of an exported dashboard.json file from Grafana
| Revision | Description | Created | |
|---|---|---|---|
| Download |