Frigate Monitoring Dashboard
A complete Grafana dashboard for monitoring Frigate with Prometheus metrics. Covers Python runtime GC stats, CPU & memory usage, camera FPS and detection performance, storage utilization, and service health. Works with Frigate’s built-in /api/metrics endpoint. Designed with modern visualizations, thresholds, and alerts.
Frigate Monitoring Dashboard
This Grafana dashboard provides a complete observability view for Frigate using Prometheus as the data source.
It is designed for Frigate installations that expose metrics via the /api/metrics endpoint and covers runtime performance, object detection efficiency, and storage usage.
Features
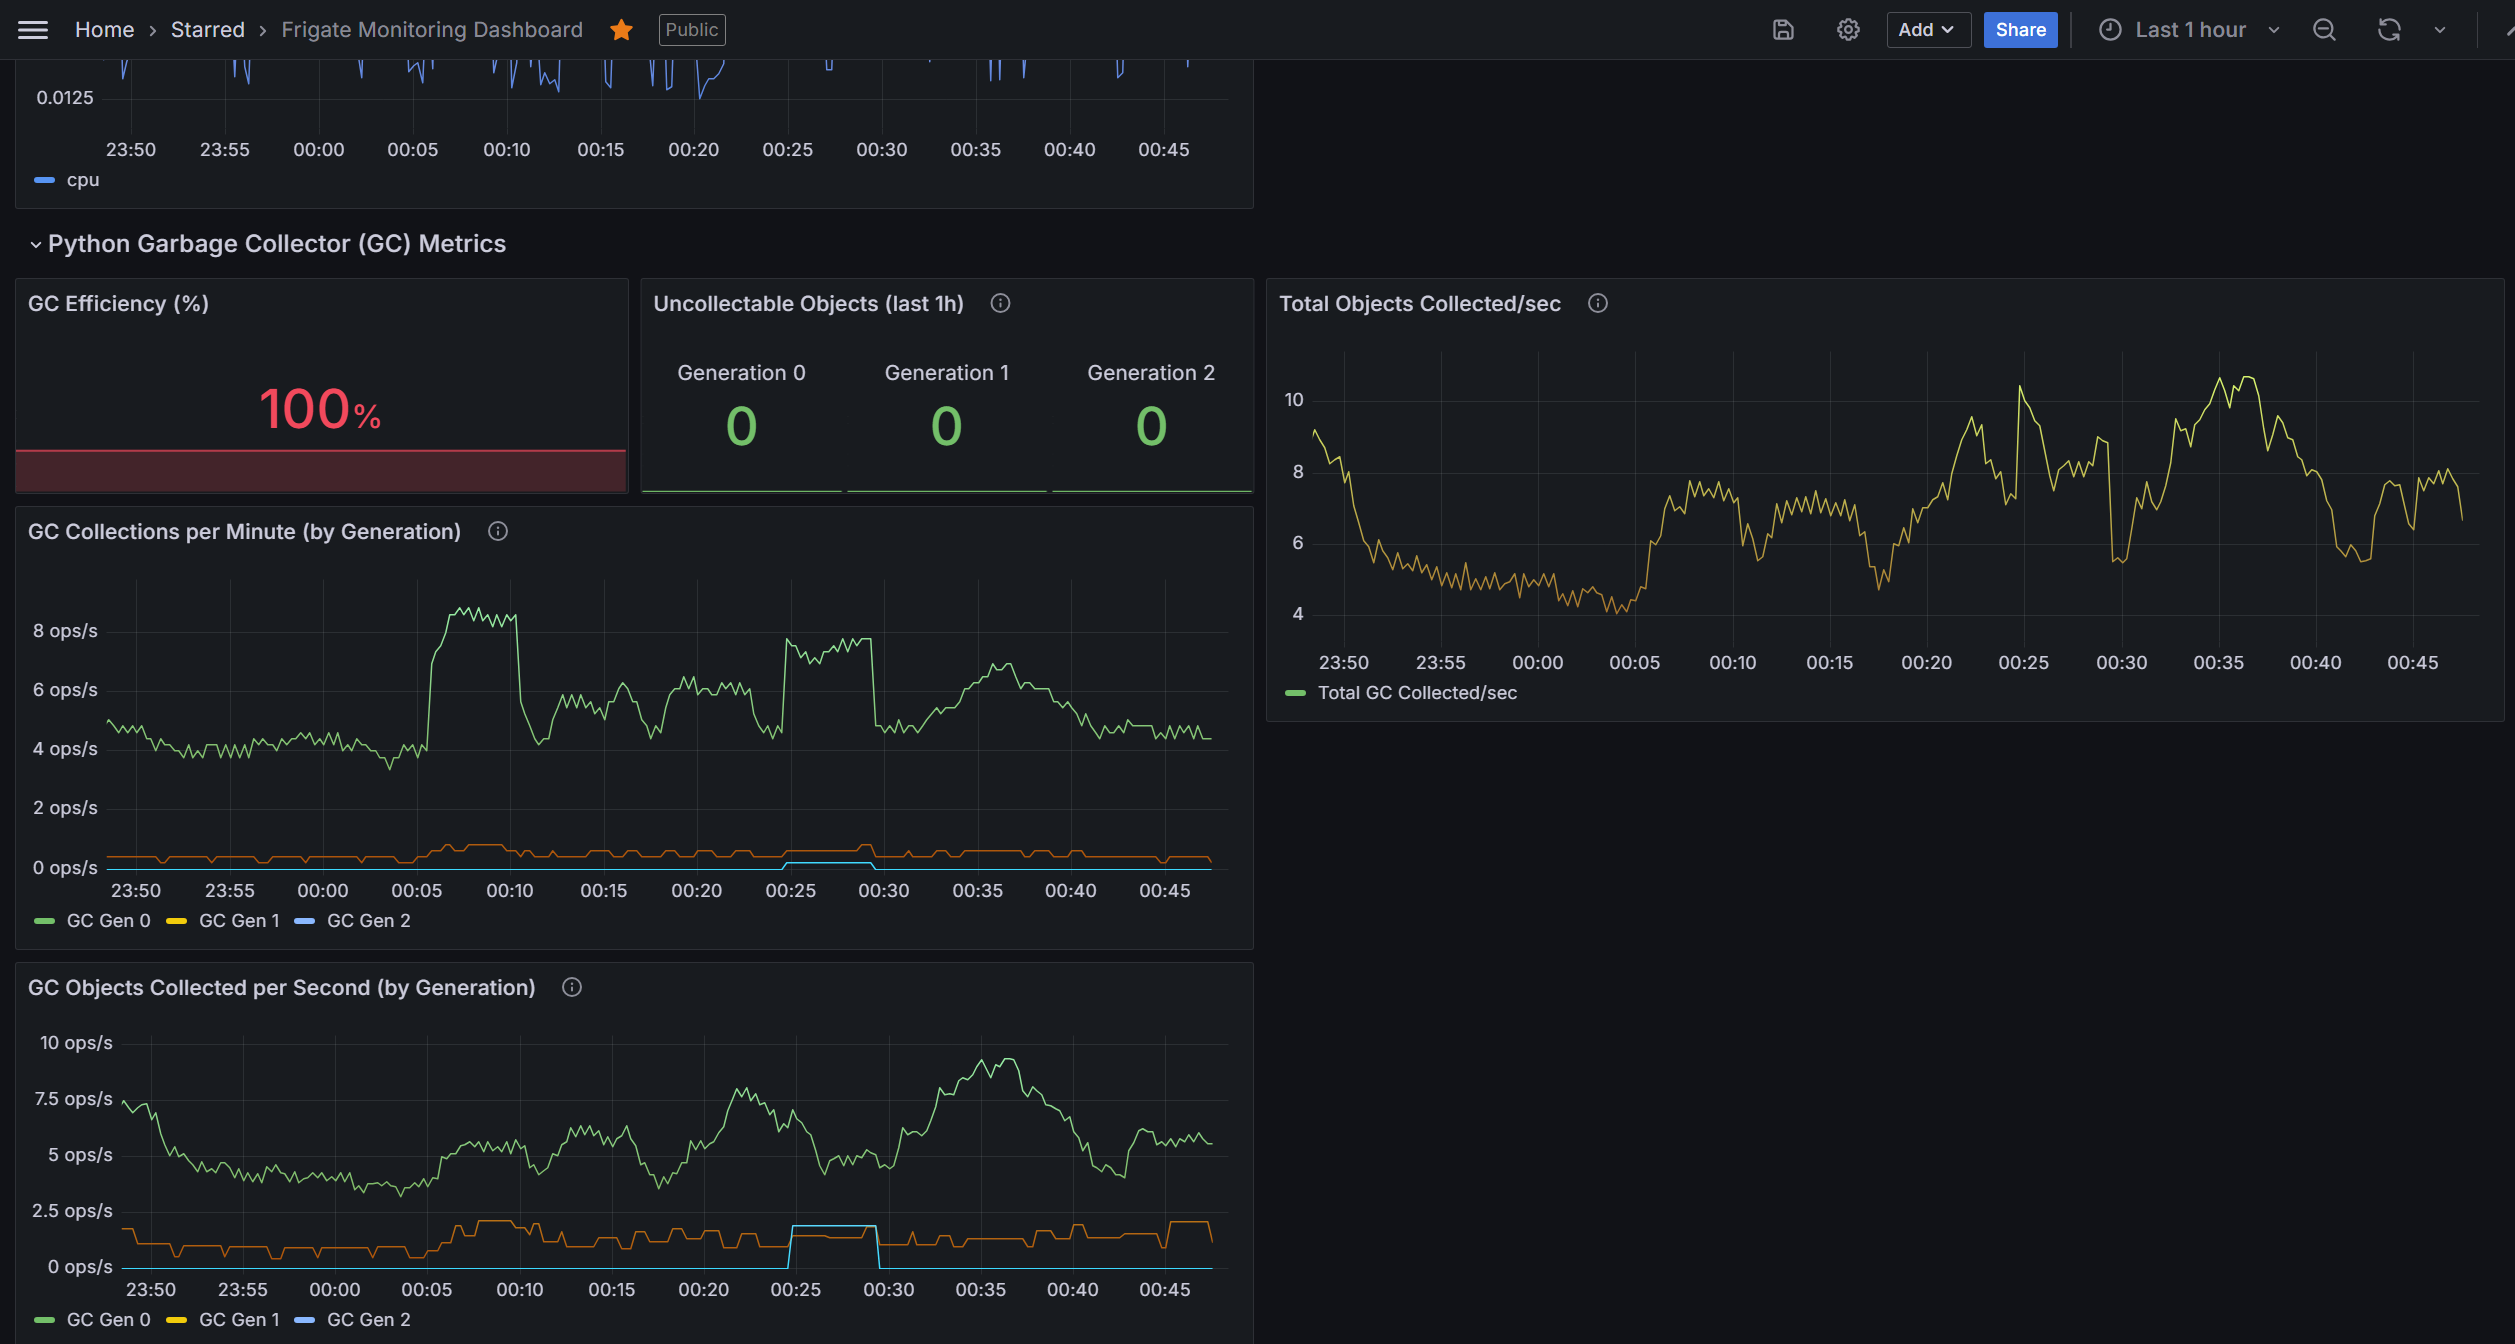
Python Runtime Monitoring
- Garbage Collector (GC) objects collected/sec, collections per generation, uncollectable objects (leak detection), GC efficiency ratio.
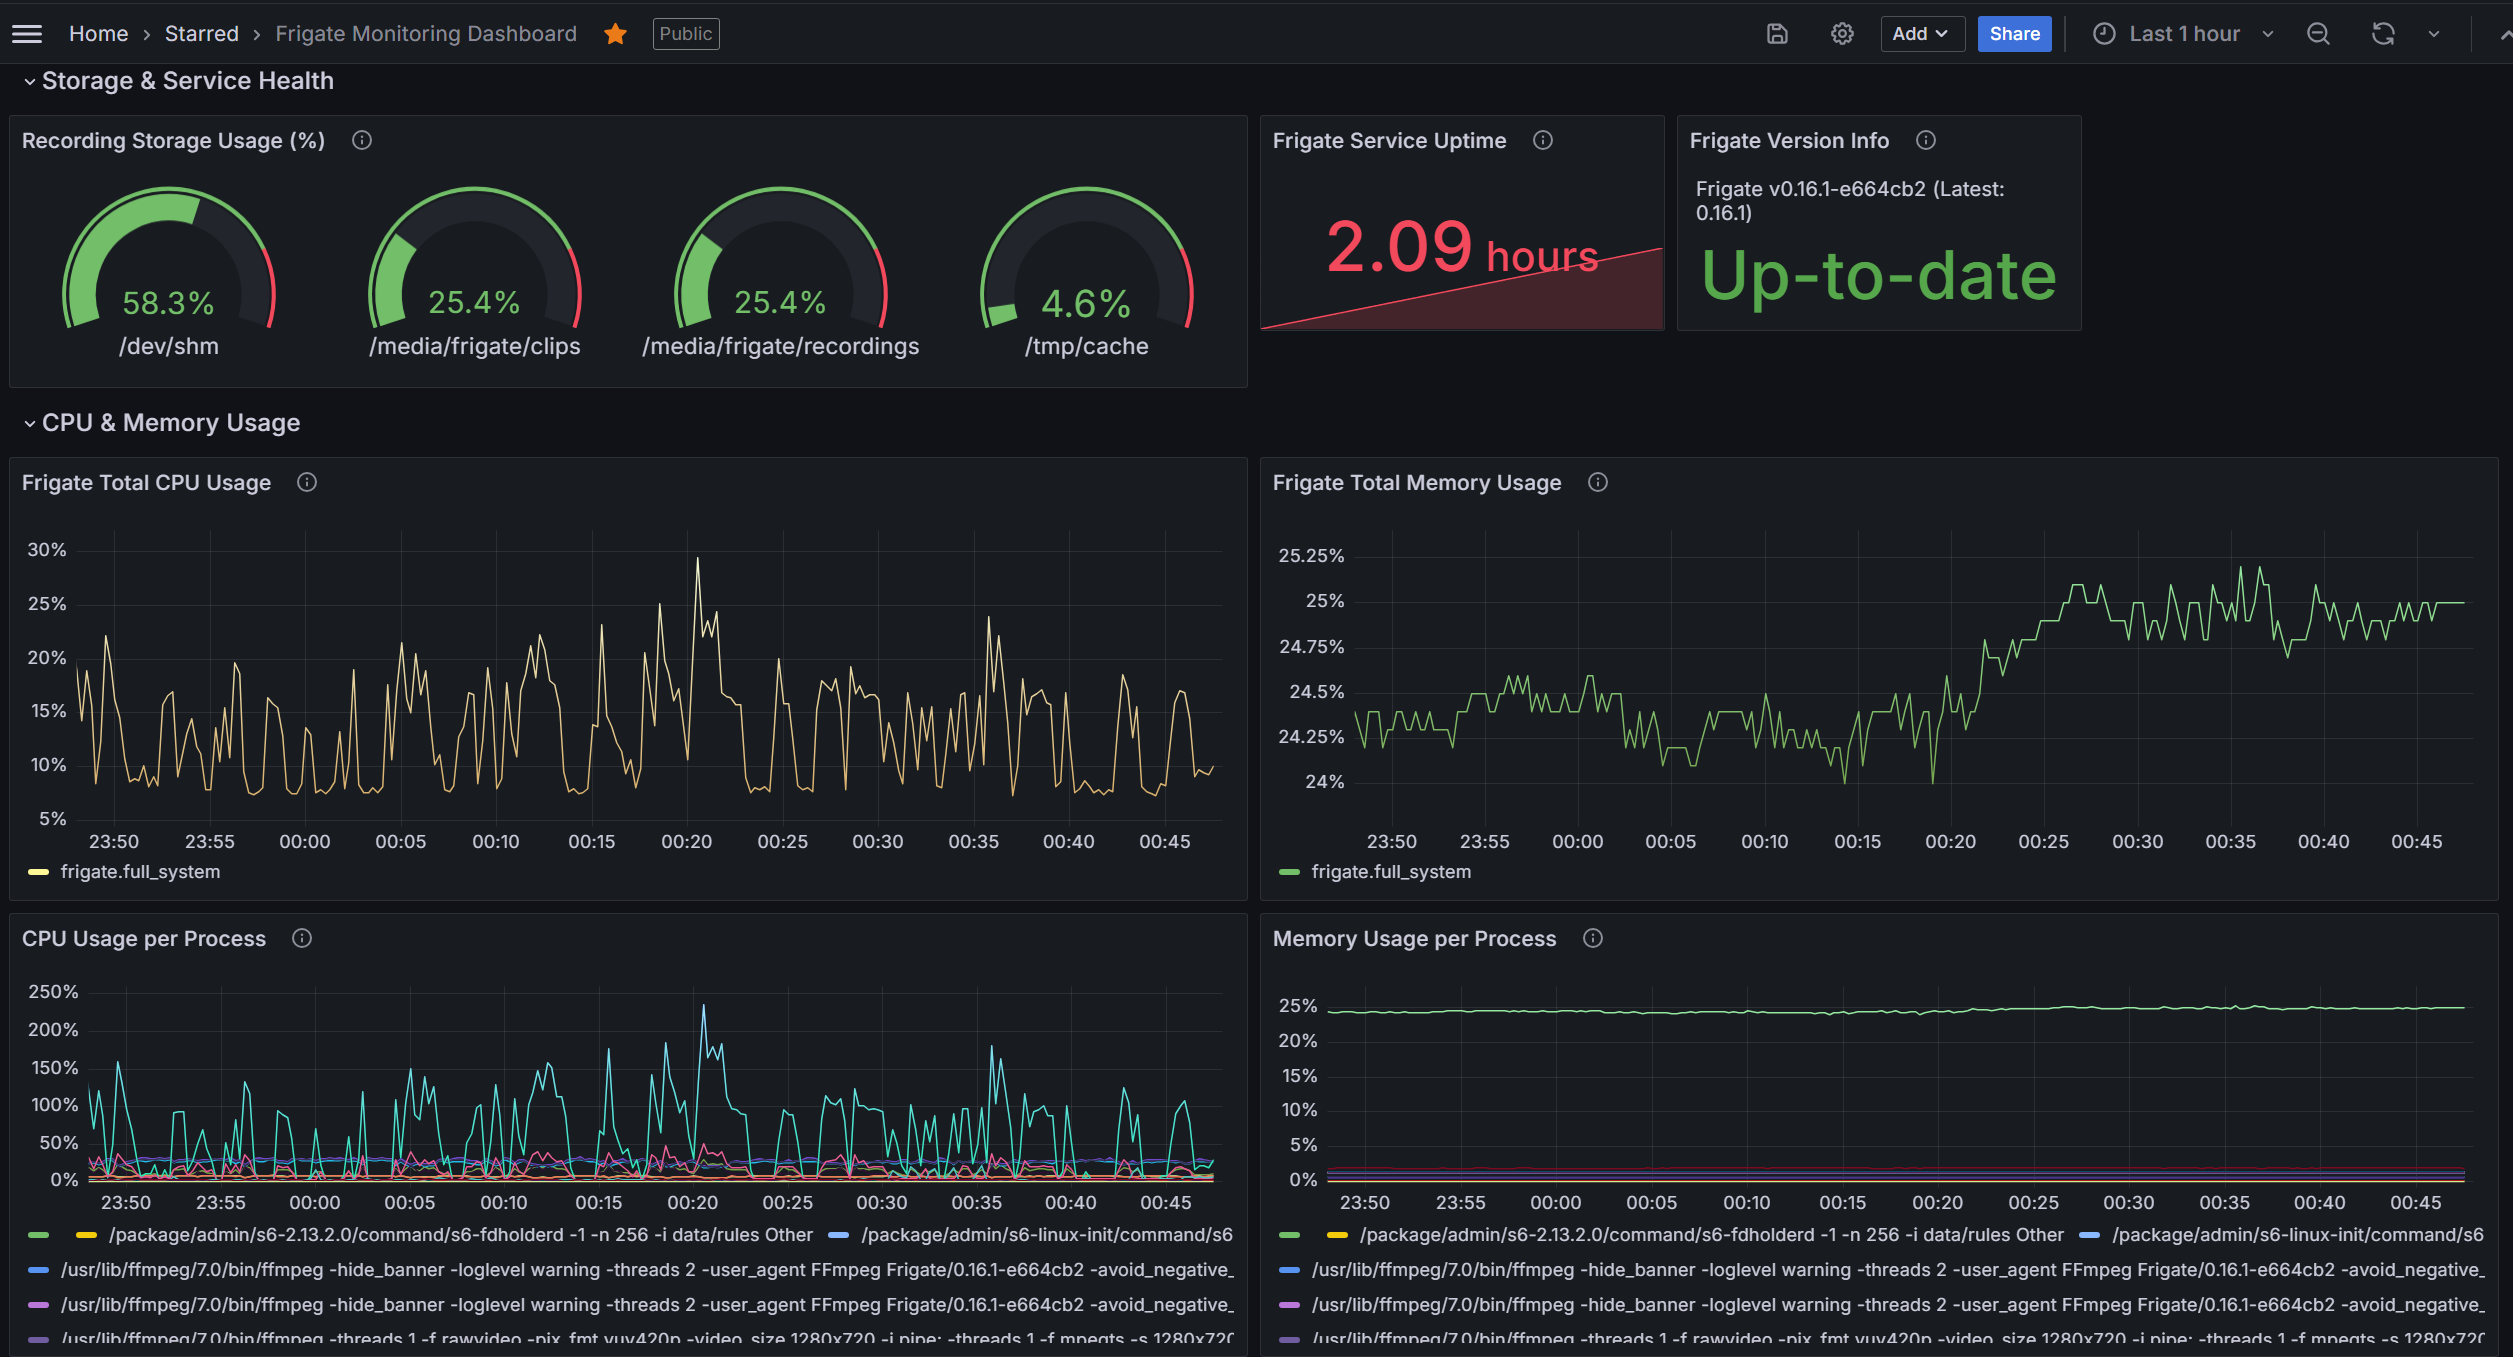
CPU & Memory Usage
- Total system CPU/memory usage.
- Per-process CPU/memory breakdown (ffmpeg, detect, capture, recording).
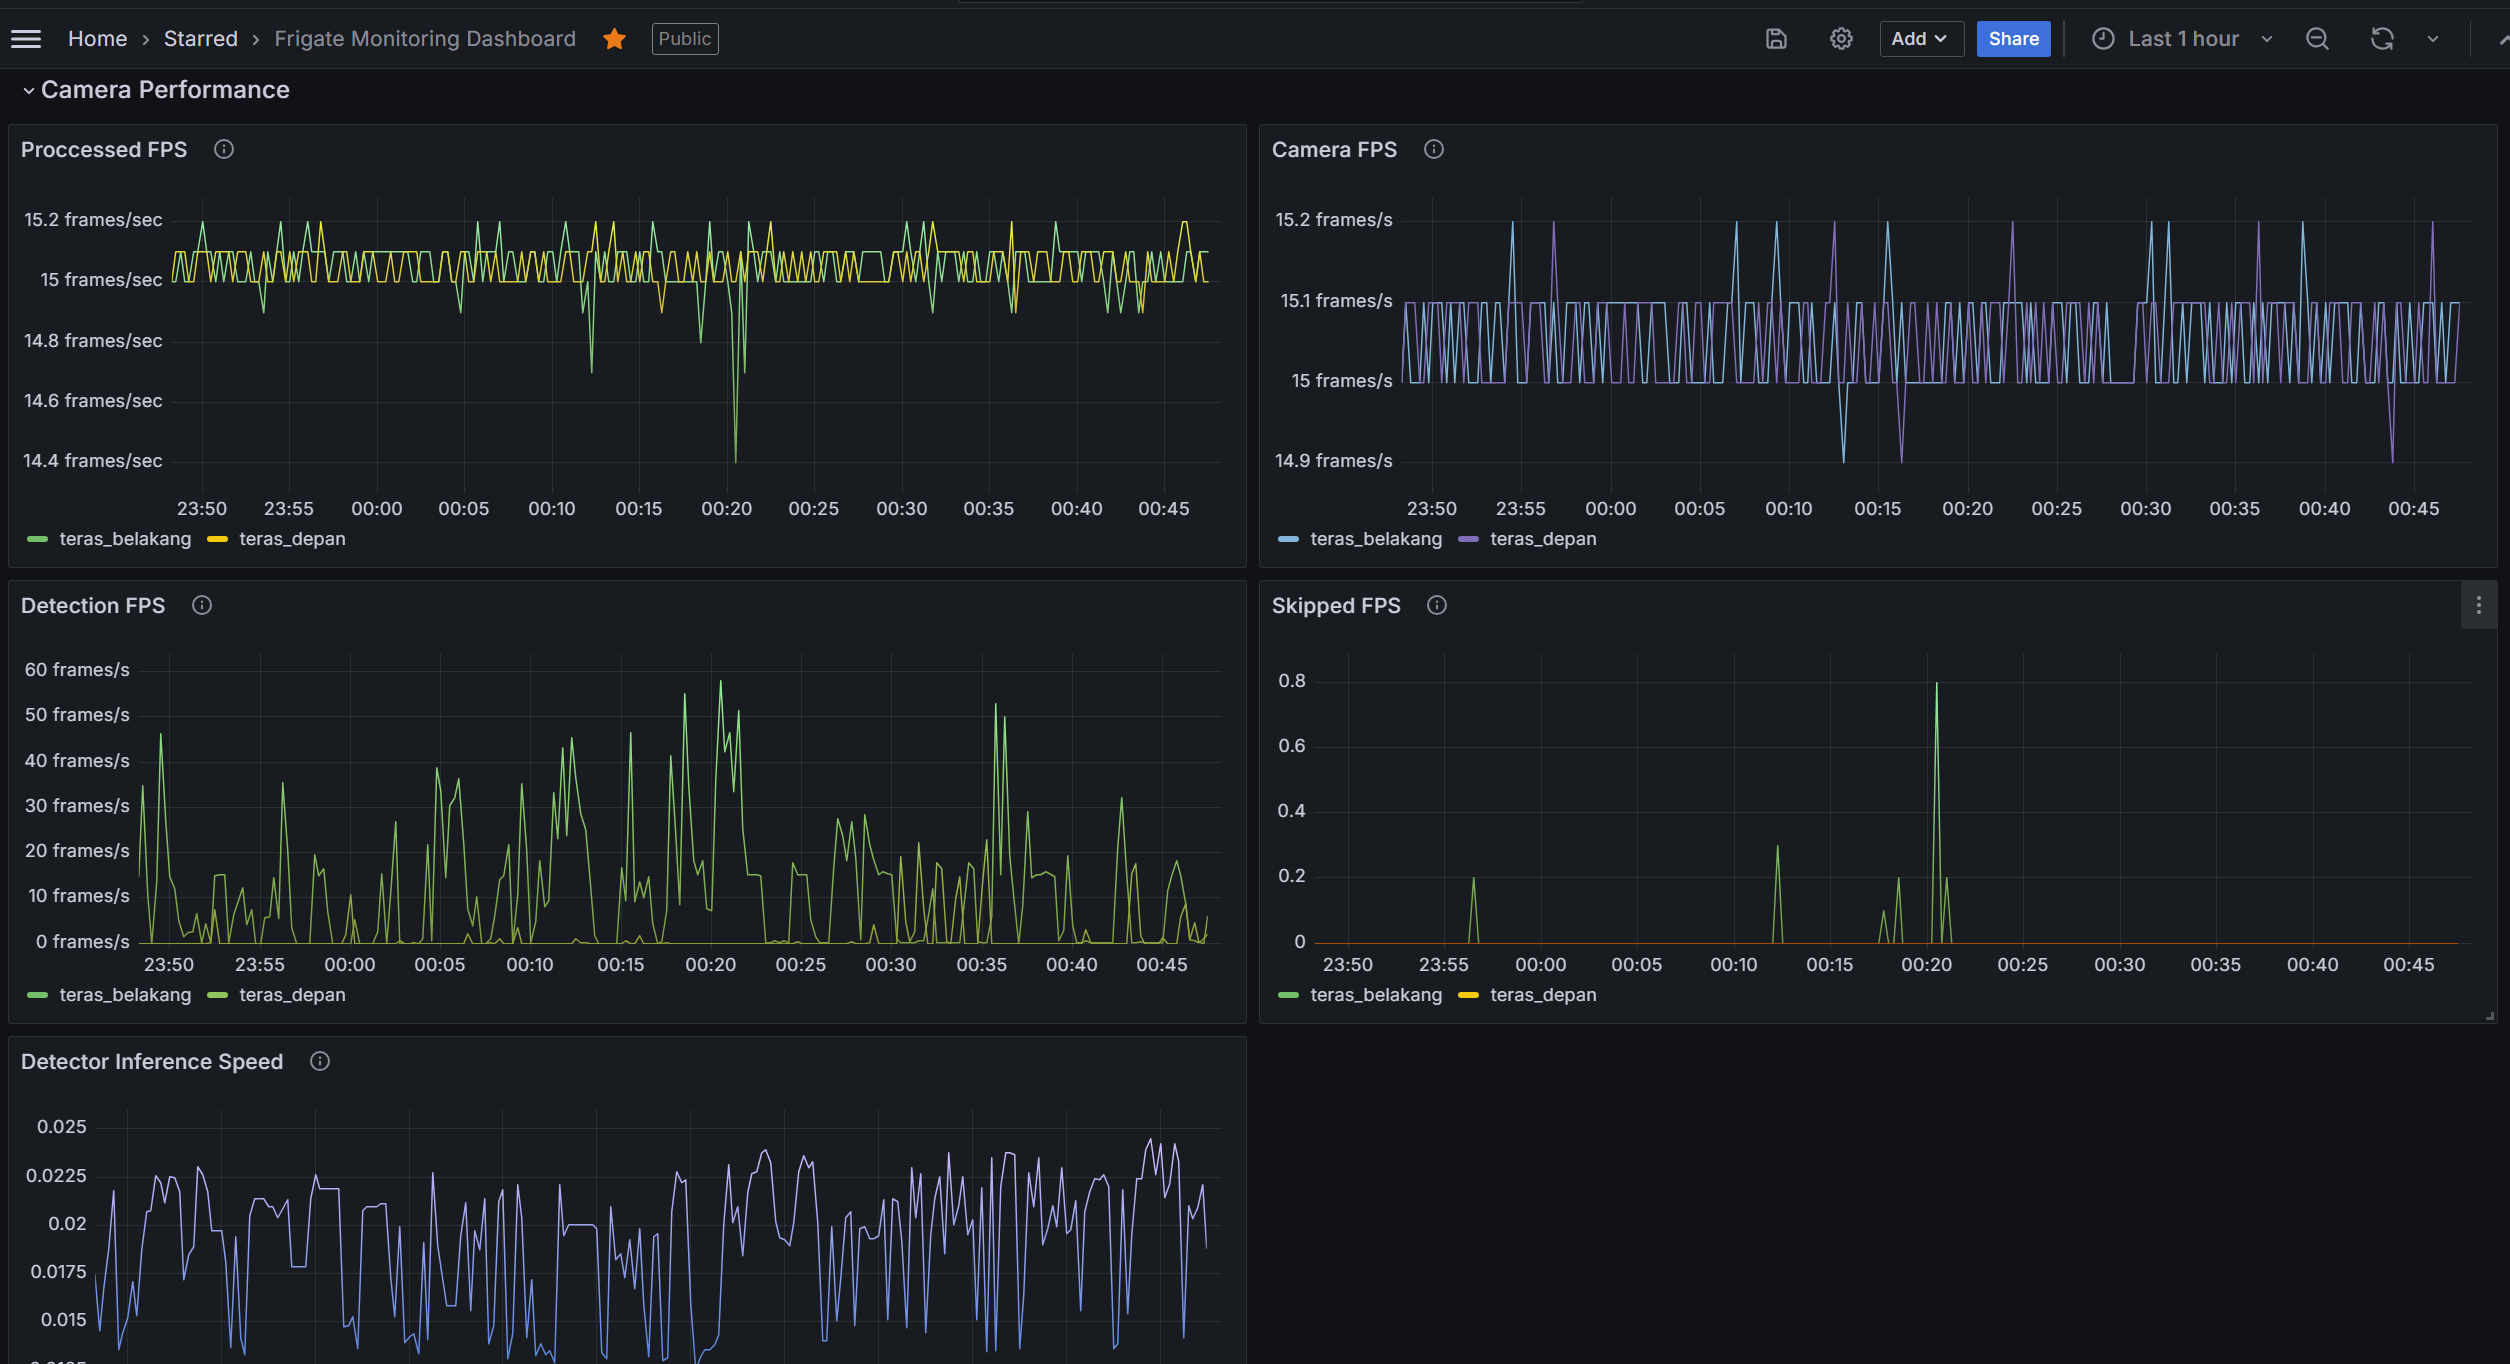
Camera Performance
- Camera input FPS vs processed FPS.
- Detection FPS and skipped FPS (frame drops).
Object Detection & Events
- Detector inference speed (CPU/GPU).
- Events per camera / per object label (if
frigate_camera_events_totalis exposed).
Storage & Service Health
- Storage usage (recordings, clips, cache, shm).
- Service uptime.
- Frigate version vs latest release (with update check).
Requirements
- Grafana ≥ 9.x
- Prometheus as datasource
- Frigate with metrics endpoint enabled (
/api/metrics)
Prometheus Configuration
Add a scrape job for Frigate in your prometheus.yml:
scrape_configs:
  - job_name: 'frigate'
    static_configs:
      - targets: ['192.168.1.50:5000']   # Replace with your Frigate host:port
    metrics_path: /api/metrics
Usage
- Import this dashboard JSON into Grafana.
- Select your Prometheus data source.
- Adjust default time ranges if needed (recommended: 1h for CPU/FPS panels, 24h for storage panels).
- (Optional) Configure alerts in Grafana for thresholds such as:
- CPU usage > 85%
- Memory usage > 90%
- Storage usage > 80%
- GC efficiency < 90%
Tags
frigate, cctv, surveillance, prometheus, grafana, monitoring, object-detection
Data source config
Collector config:
Upload an updated version of an exported dashboard.json file from Grafana
| Revision | Description | Created | |
|---|---|---|---|
| Download |