AWS RDS/MQ/ElastiCache Dashboard
RDS/AmazonMQ/ElastiCache
Overview
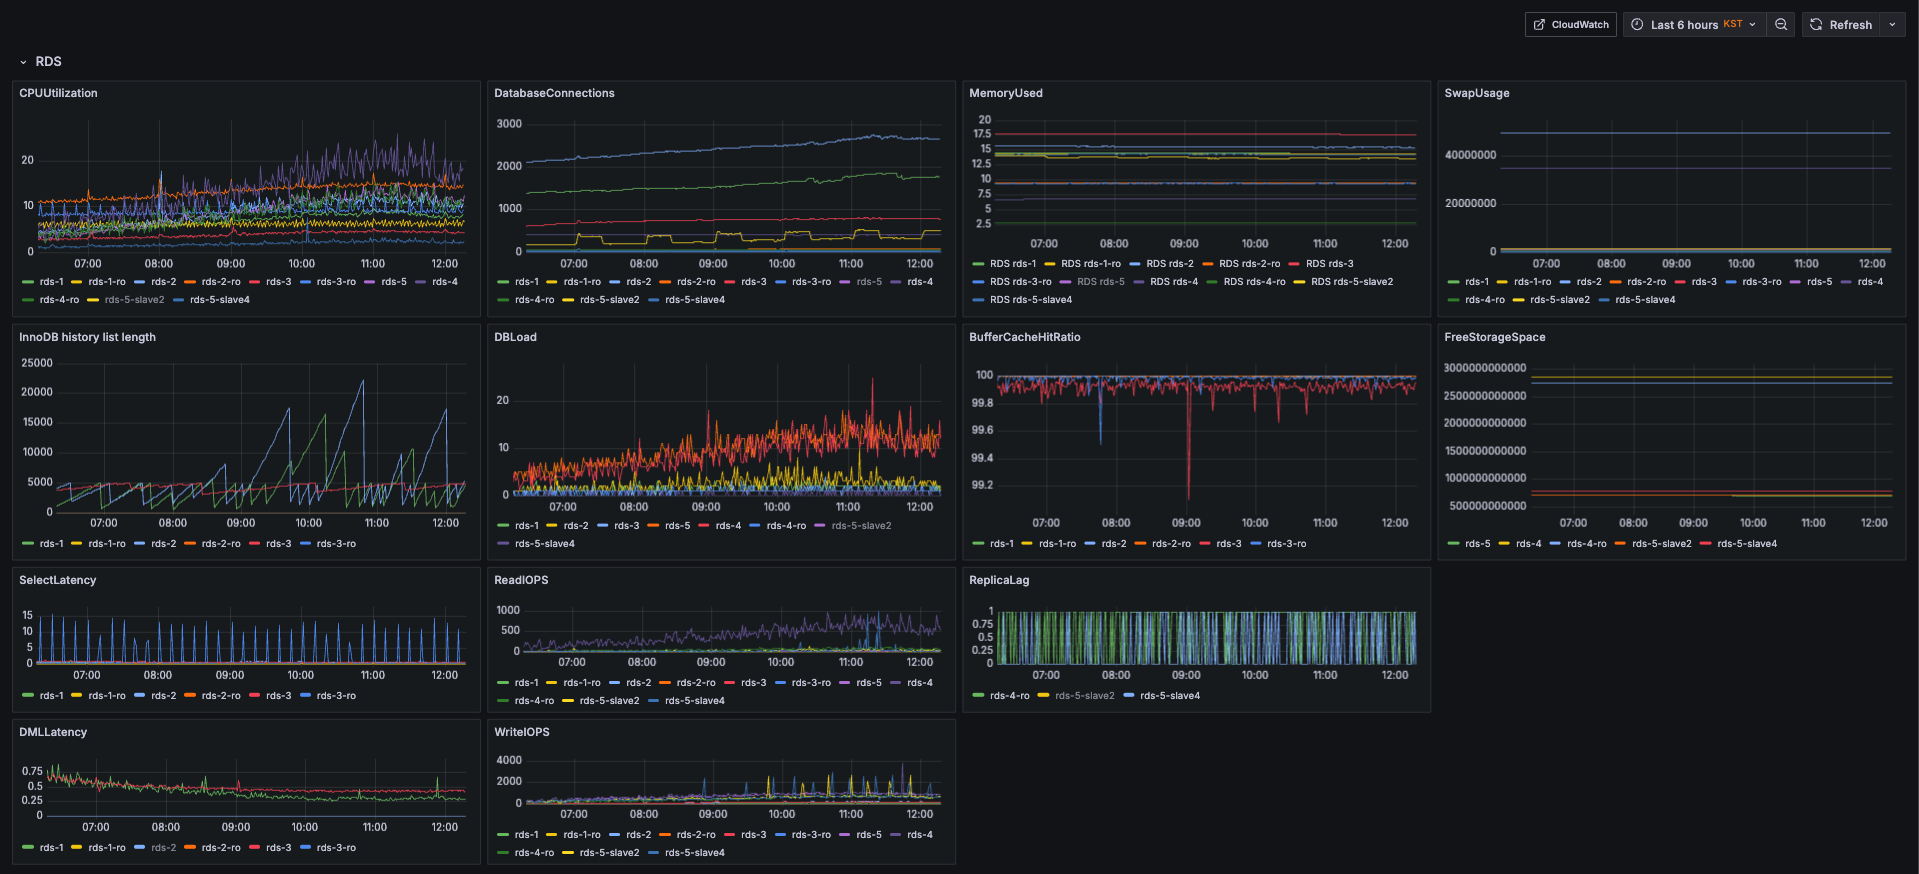
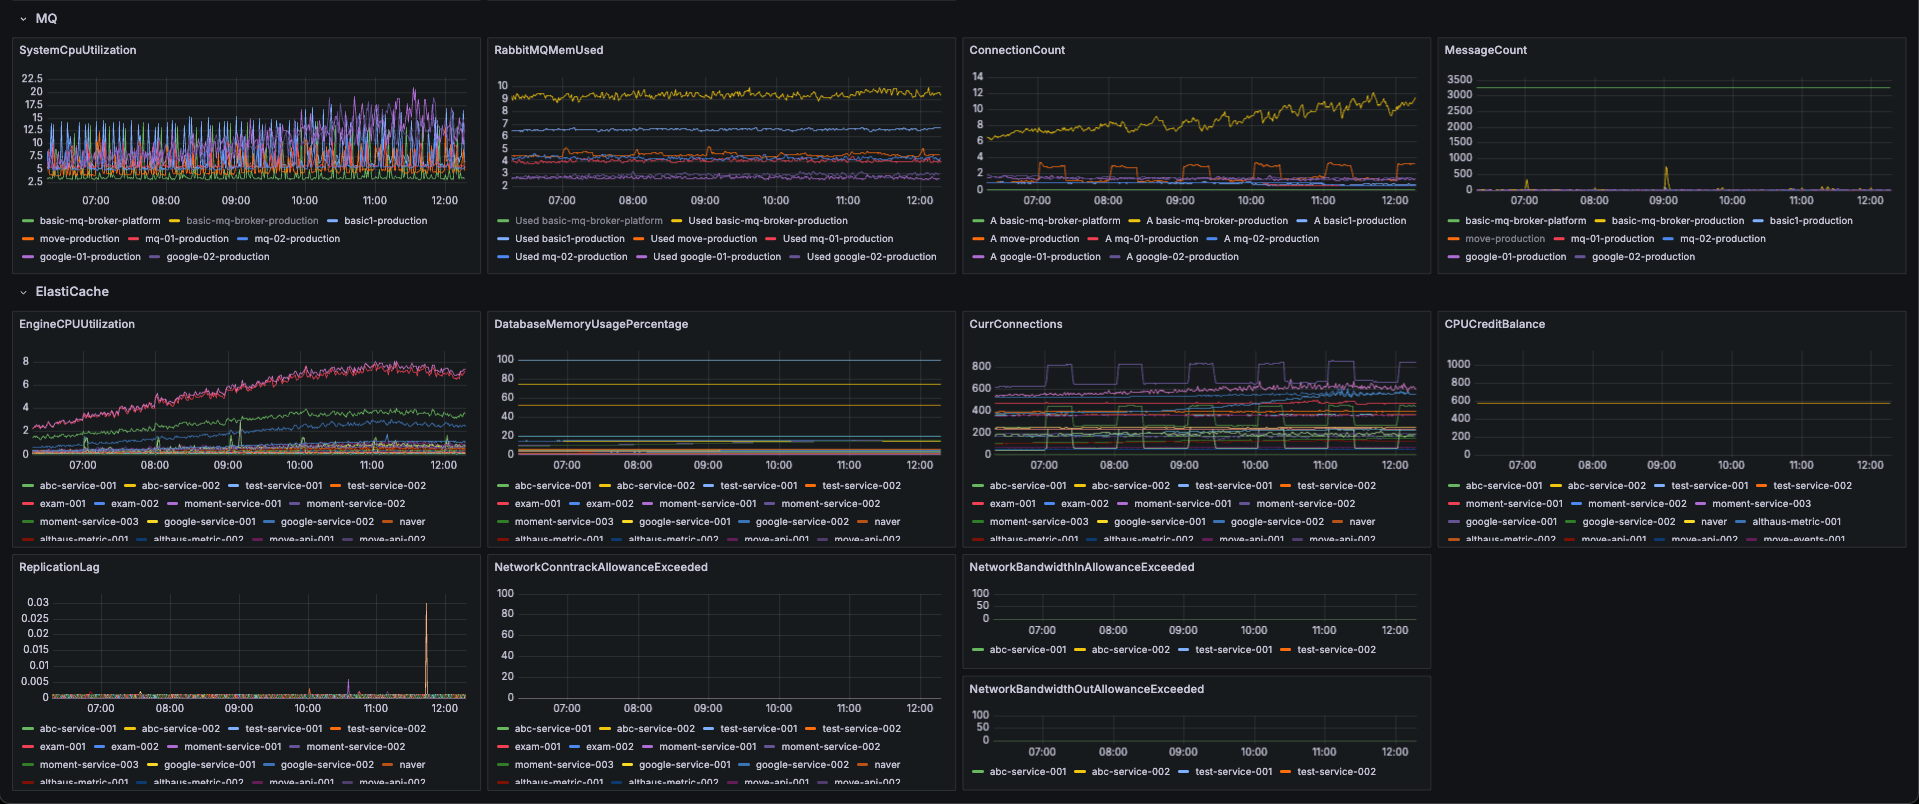
This dashboard visualizes Amazon RDS, Amazon MQ, and Amazon ElastiCache metrics collected via Amazon CloudWatch. It helps you monitor database and messaging workloads, identify performance bottlenecks, and troubleshoot latency or throughput issues.
Features
RDS: CPU, memory, IOPS, connections, free storage
MQ: message rates, queue depth, broker health
ElastiCache: CPU utilization, memory usage, cache hits/misses, replication lag
Unified CloudWatch queries to simplify monitoring across services
Requirements
Grafana with CloudWatch data source configured (IAM role or access keys with cloudwatch:GetMetricData permissions)
Properly tagged AWS resources for easy filtering
Usage
Configure AWS CloudWatch as a Grafana data source.
Import this dashboard JSON into Grafana.
Data source config
Collector config:
Upload an updated version of an exported dashboard.json file from Grafana
| Revision | Description | Created | |
|---|---|---|---|
| Download |
AWS
Easily visualize and alert on more than 60 Amazon Web Services (AWS) resources using the fully managed Grafana Cloud platform.
Learn more