SMAP - Passive Recon & Threat Intelligence
Cyber threat intelligence dashboard for Smap passive network reconnaissance via Shodan.io. Real-time visibility into targets, open ports, services, OS fingerprints, CVE exposure, CVSS scoring, technology stacks, host tags and risk levels.
Passive network reconnaissance and threat intelligence dashboard for Smap — a drop-in Nmap replacement powered by Shodan.io's free InternetDB API.
Smap scans ~200 hosts/second with zero contact to targets. Results are imported into a local SQLite database via a Python pipeline that extracts CVSS scores, severity levels, technology stacks (CPE parsing), SSL/TLS certificate details, geo-enrichment, and auto-generated host tags. This dashboard visualizes everything.
Dashboard (30+ panels, 4 sections)
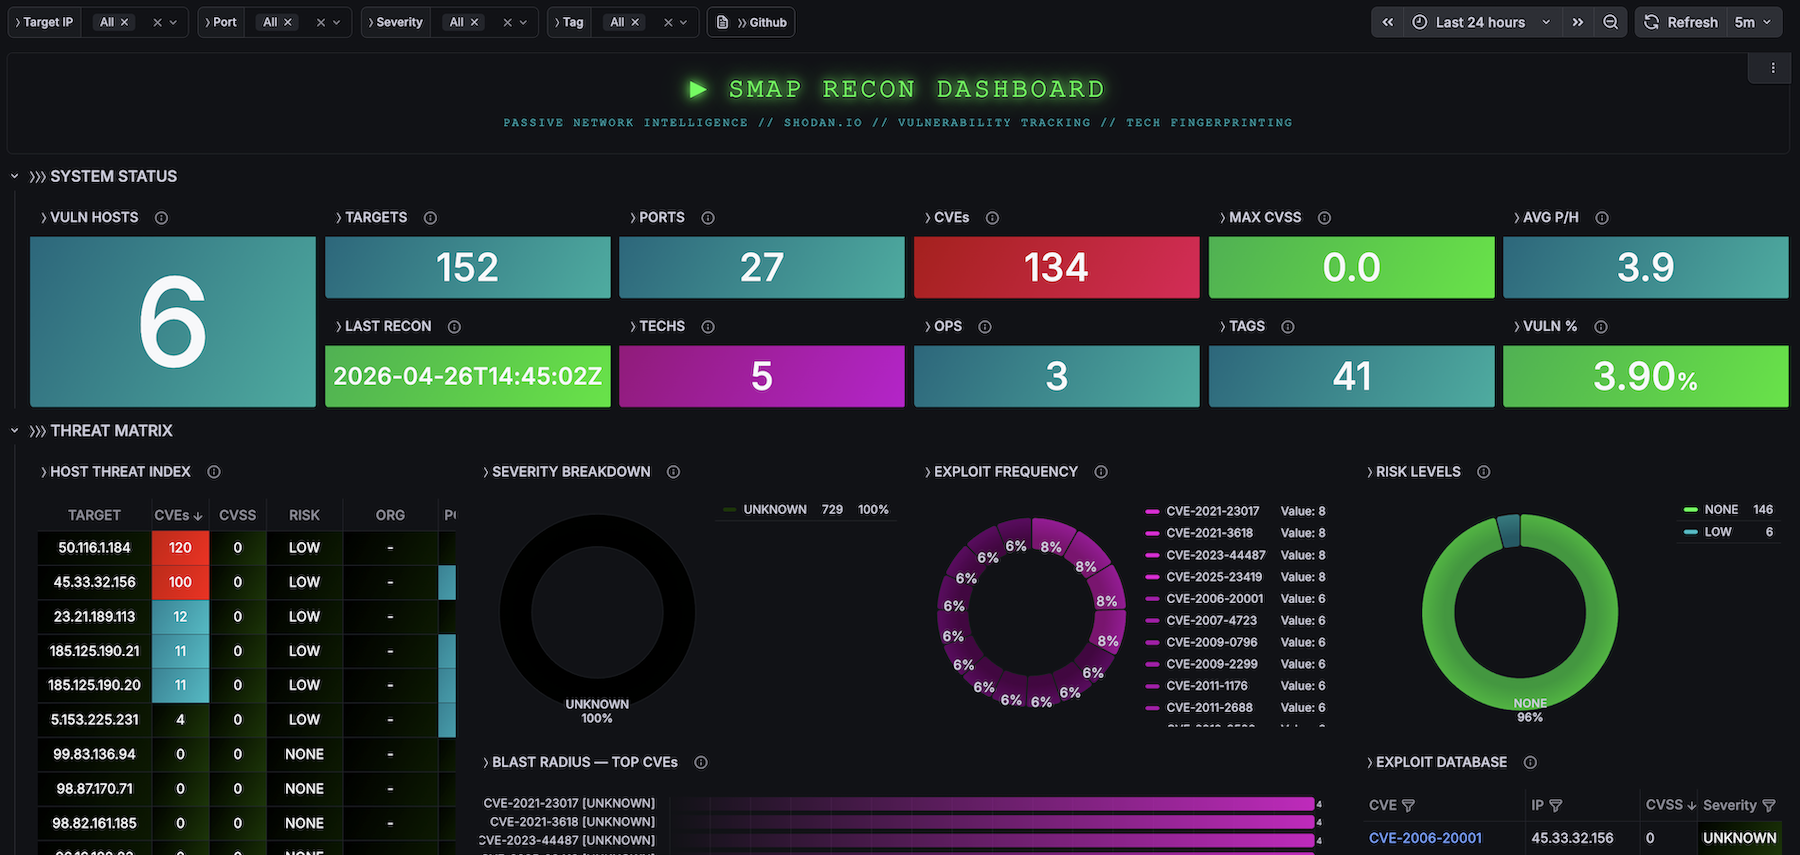
SYSTEM STATUS
Real-time KPIs: total targets, open ports, unique CVEs, technologies detected, host tags, vulnerability ratio, max CVSS score, average ports per host.
THREAT MATRIX
- Host Threat Index — sortable table with IP, vuln count, max CVSS, risk level, organization
- Severity Breakdown — donut chart (CRITICAL / HIGH / MEDIUM / LOW / UNKNOWN)
- Exploit Frequency — top 15 most common CVEs
- Risk Levels — host distribution by computed risk level
- Blast Radius — CVEs ranked by number of affected hosts
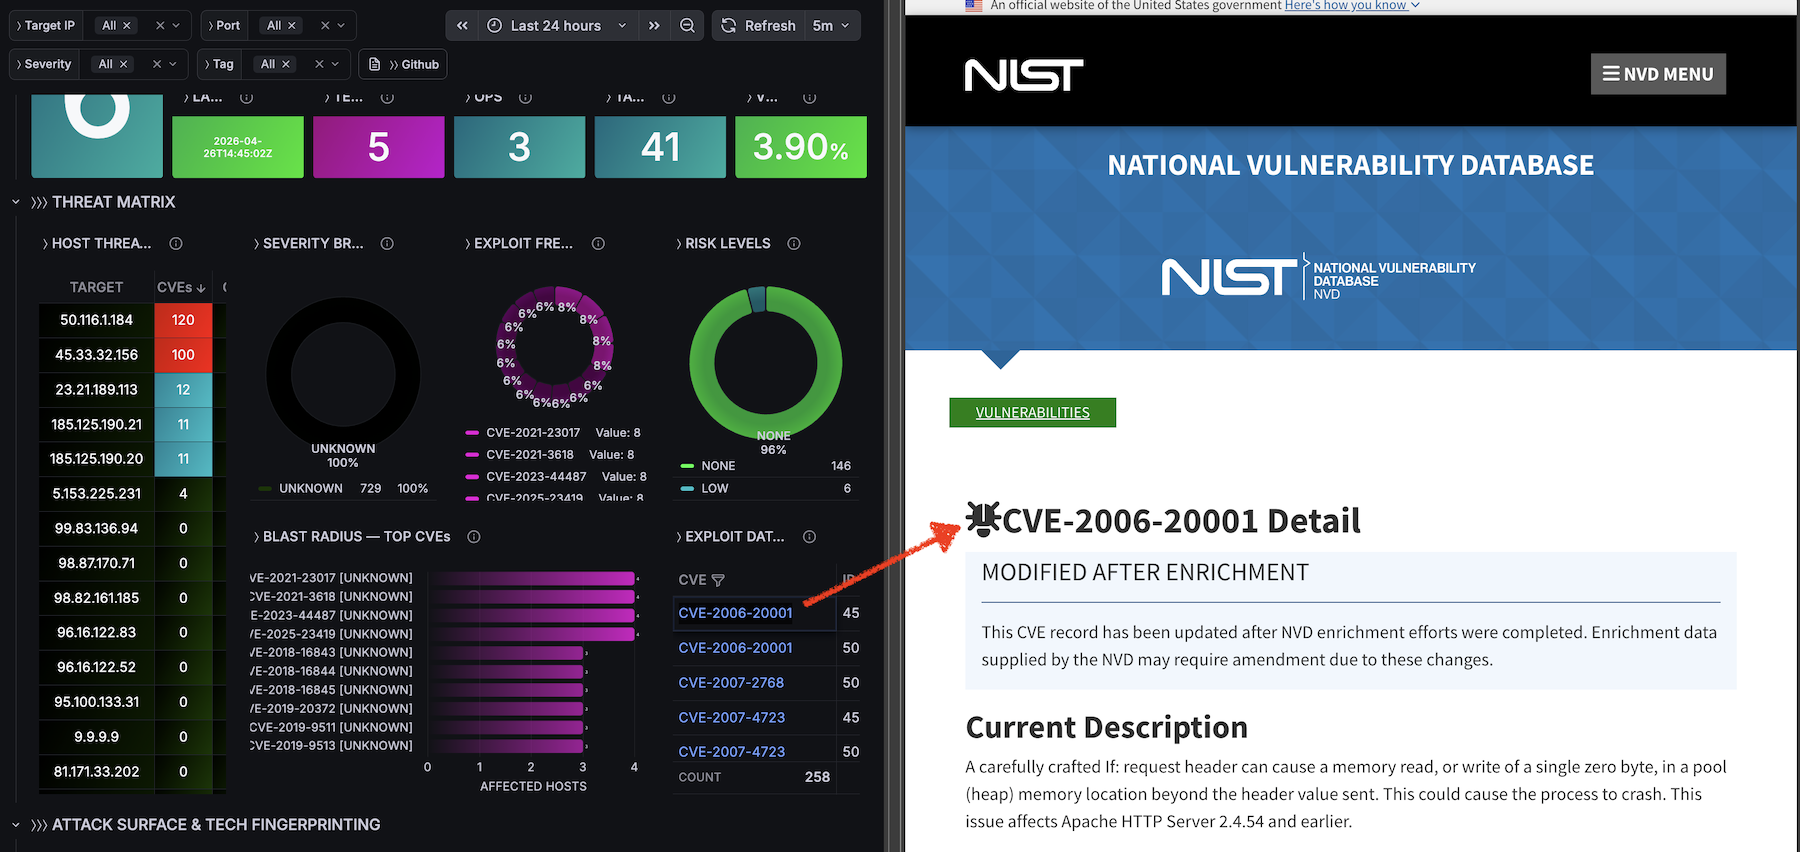
- Exploit Database — filterable CVE ↔ IP ↔ CVSS ↔ Severity ↔ Port ↔ Service table with NVD deep-links
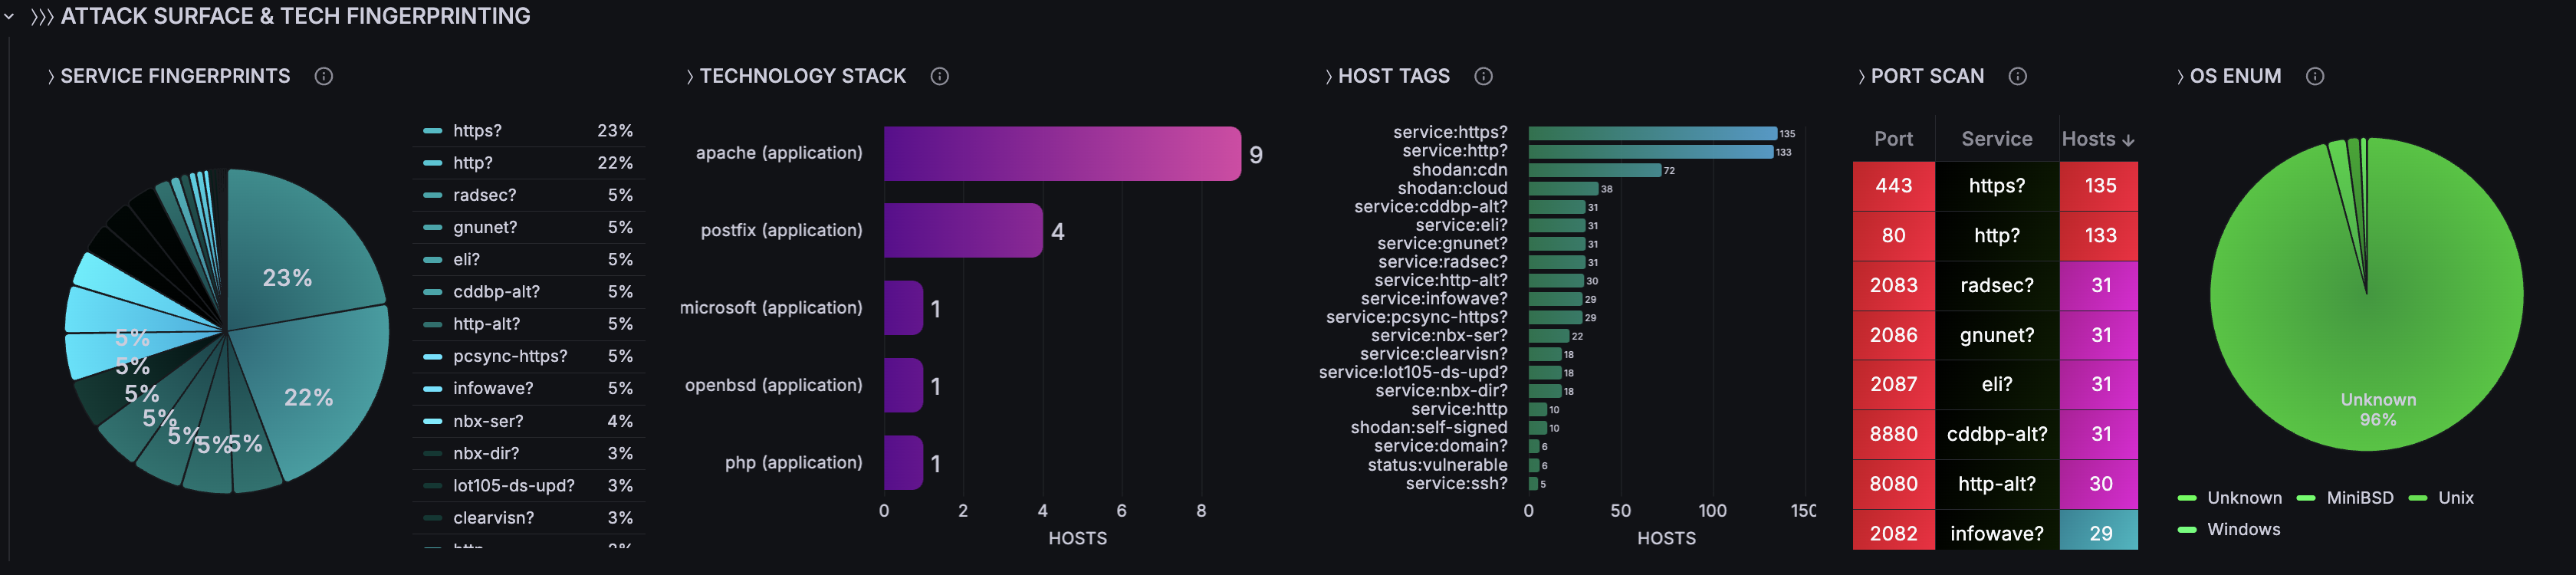
ATTACK SURFACE & TECH FINGERPRINTING
- Service Fingerprints — pie chart of service/product distribution
- Technology Stack — bar chart of technologies by host count (parsed from CPE strings)
- Host Tags — bar chart showing tag distribution (shodan, os, service, status)
- Port Scan — port/service/host count table
- OS Enumeration — OS distribution pie chart
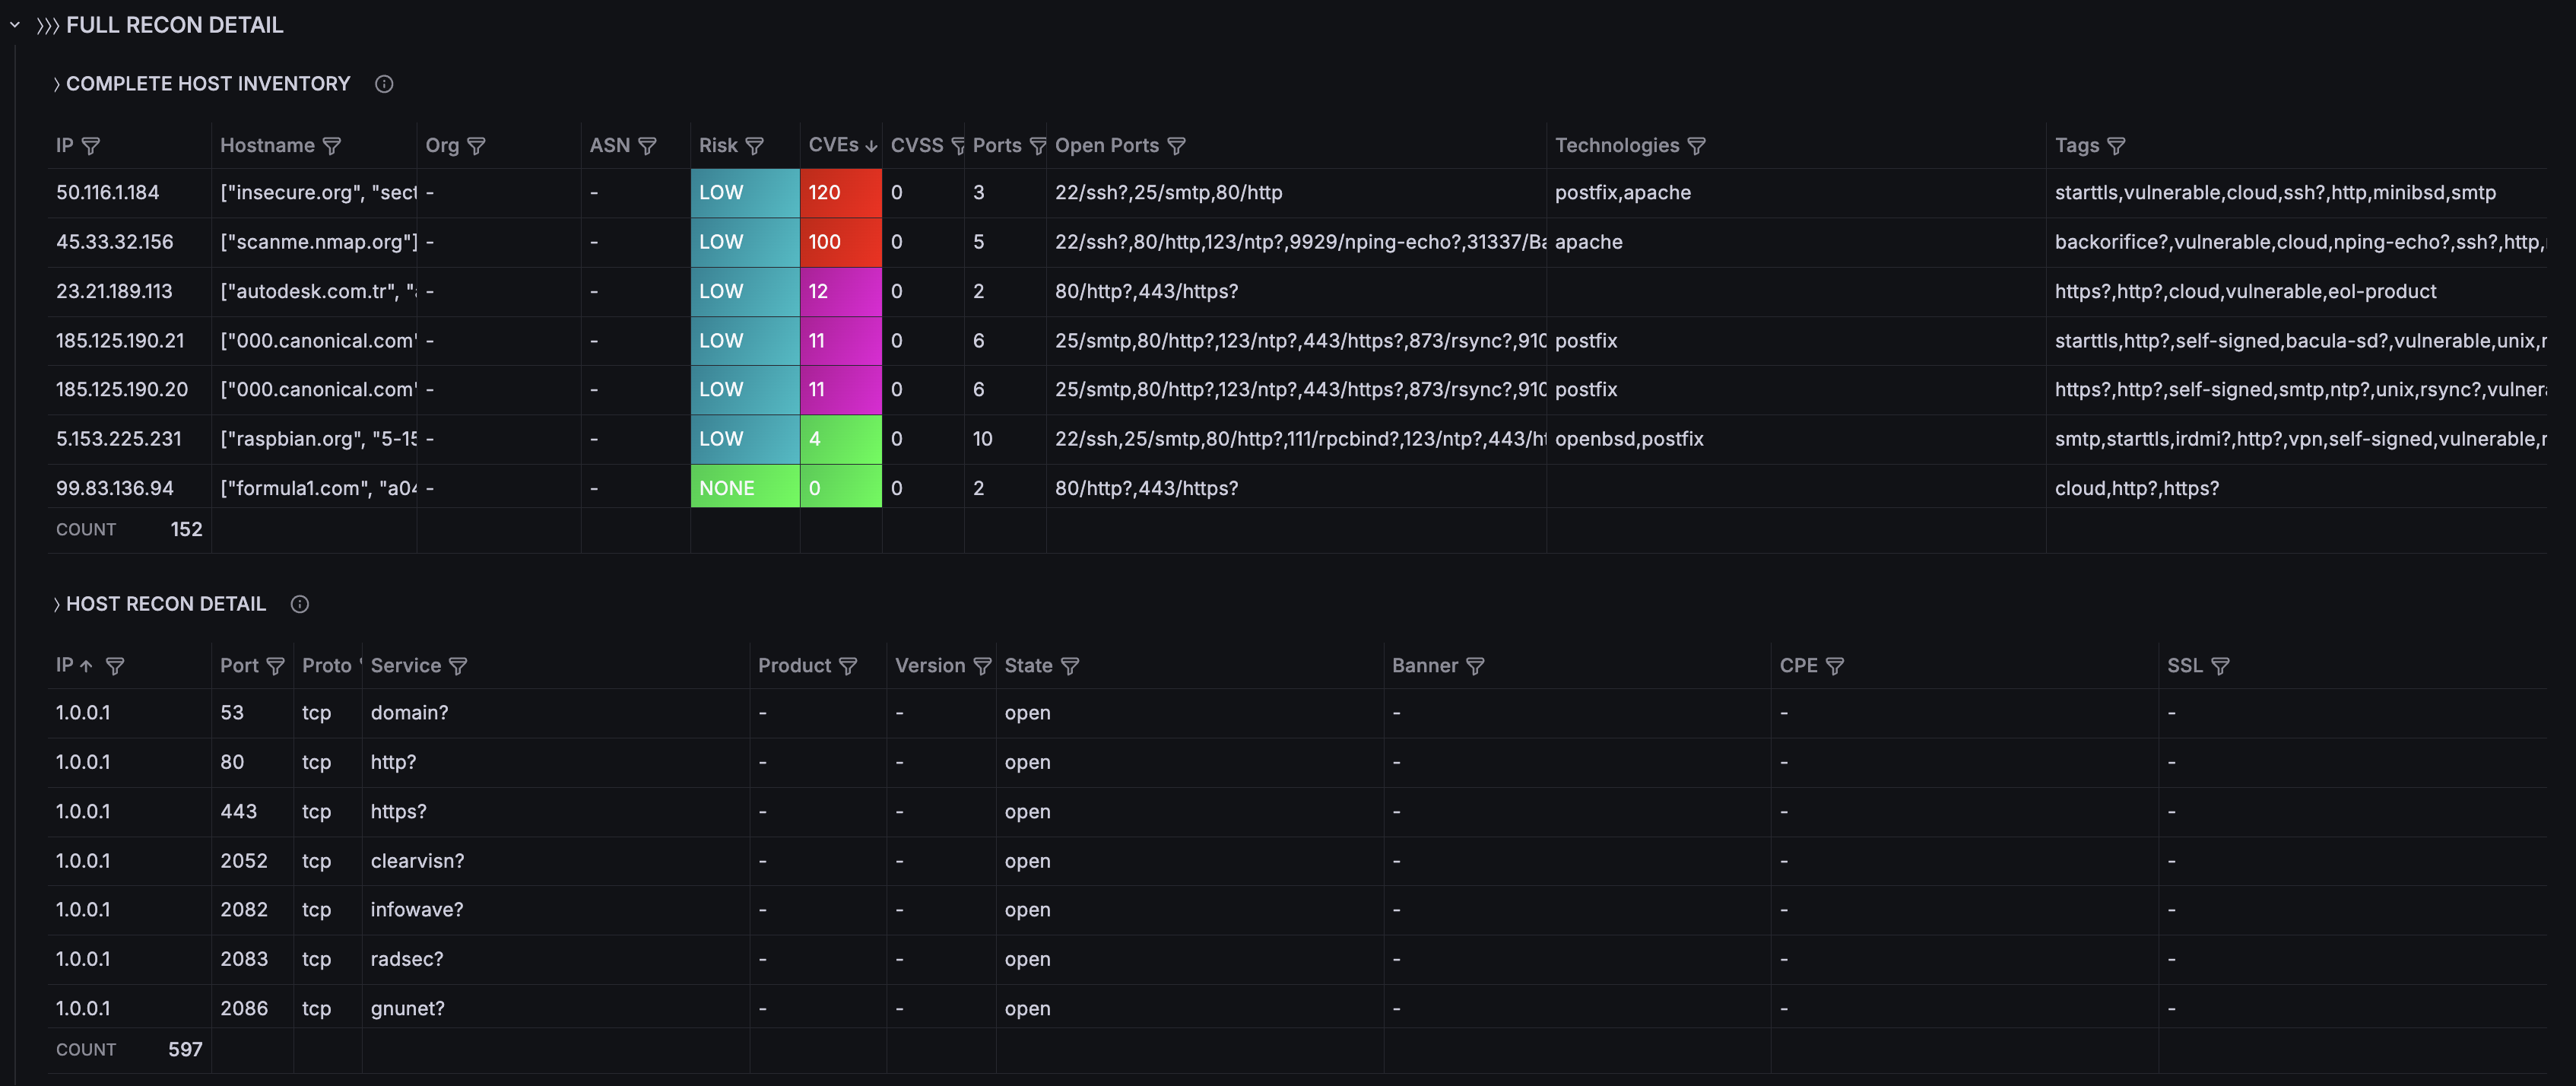
- Complete Host Inventory — IP, hostname, org, ASN, risk level, CVEs, CVSS, ports, technologies, tags
- Host Recon Detail — port, proto, service, product, version, banner, CPE, SSL indicator
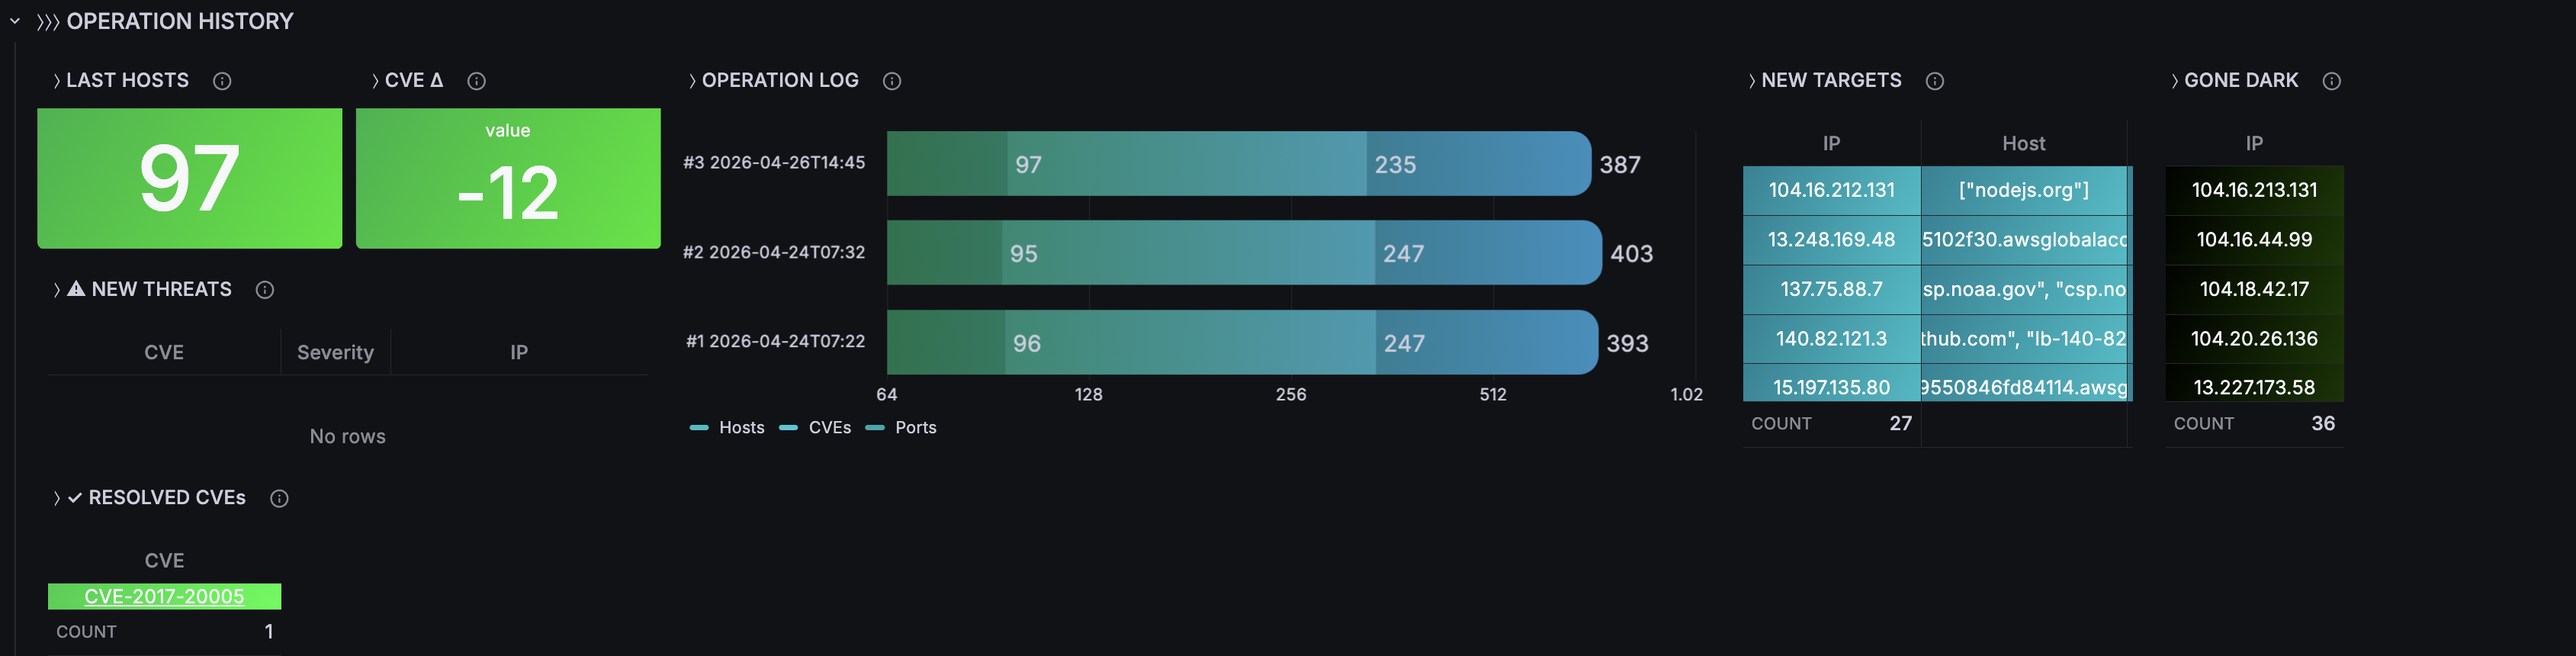
OPERATION HISTORY
- Scan-over-scan comparison: hosts/CVEs/ports per operation
- New Targets — IPs appearing for the first time
- Gone Dark — IPs that disappeared
- New Threats — CVEs first detected in latest scan (with severity)
- Resolved CVEs — CVEs no longer present
- CVE Delta — vulnerability count change between scans
Filter Variables (4)
All panels react in real-time to:
- Target IP (multi-select)
- Port (multi-select)
- Severity (CRITICAL, HIGH, MEDIUM, LOW, UNKNOWN)
- Tag (vulnerable, ssl/tls, http, etc.)
Database Schema (7 tables)
- scans — scan metadata and totals
- hosts — IP, hostname, OS, geo, org, ASN, vuln_count, max_cvss, risk_level
- ports — port, protocol, service, product, version, banner, CPE, SSL details
- vulnerabilities — CVE, CVSS, severity, summary, references
- technologies — CPE-parsed: category (application/os/hardware), name, version
- host_tags — auto-tags with source (shodan/os/service/status)
CVSS Severity Classification
- CRITICAL: 9.0–10.0
- HIGH: 7.0–8.9
- MEDIUM: 4.0–6.9
- LOW: 0.1–3.9
- NONE: 0.0
- UNKNOWN: no score available
Requirements
- Docker 20.x+ and Docker Compose v2
- No Shodan API key needed (uses free InternetDB endpoint)
- ~2 minutes to deploy
Quick Start
git clone https://github.com/czantoine/smap-grafana-dashboard cd smap-grafana-dashboard/quickstart docker compose up -d
Open http://localhost:3009 — Login: admin/admin
Data Source
SQLite via frser-sqlite-datasource plugin. The datasource and dashboard are auto-provisioned — zero manual configuration.
Links
Data source config
Collector config:
Upload an updated version of an exported dashboard.json file from Grafana
| Revision | Description | Created | |
|---|---|---|---|
| Download |