BU-MTVLAB SpringBoot Observability
To setup observability for spring boot apps - https://brainupgrade.in
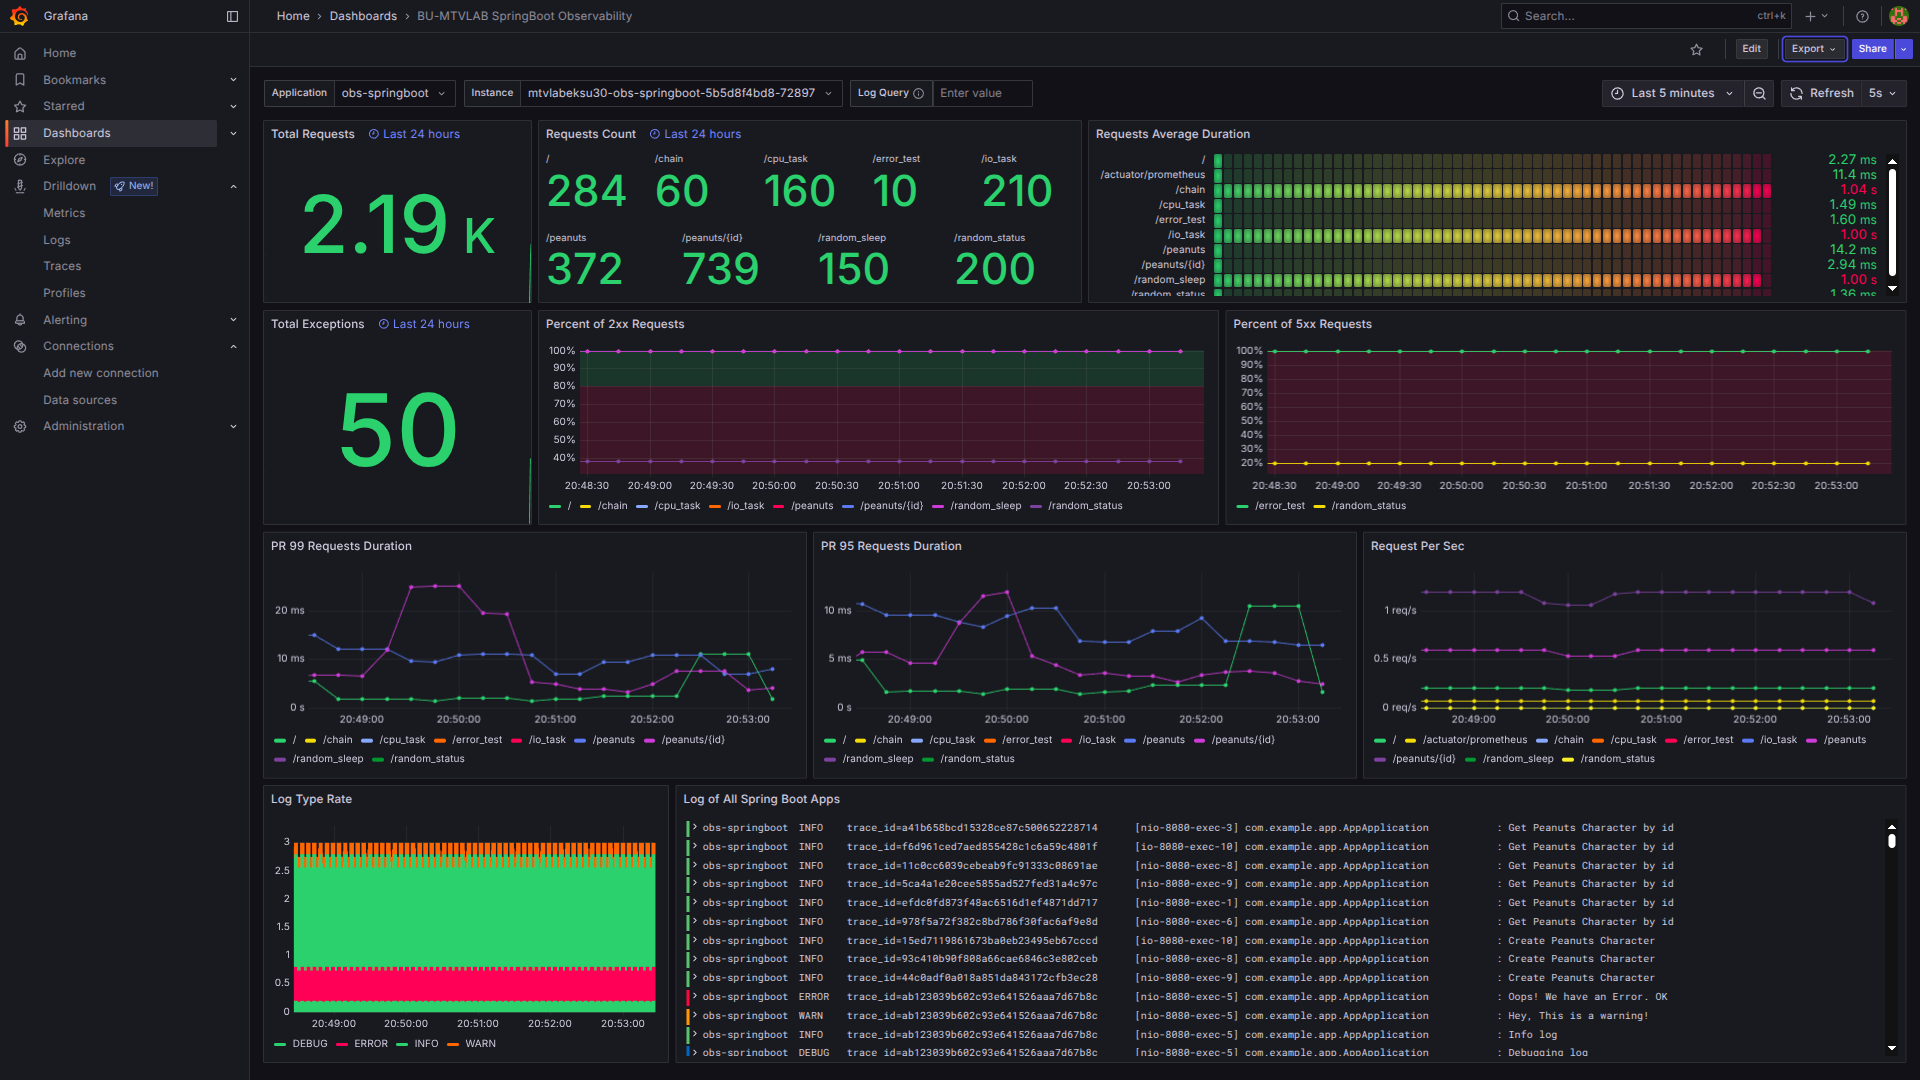
The BU-MTVLAB SpringBoot Observability dashboard uses the loki and prometheus data sources to create a Grafana dashboard with the bargauge, logs, stat and timeseries panels.
Data source config
Collector type:
Collector plugins:
Collector config:
Revisions
Upload an updated version of an exported dashboard.json file from Grafana
| Revision | Description | Created | |
|---|---|---|---|
| Download |