Junos 12.3+ SNMP Prometheus
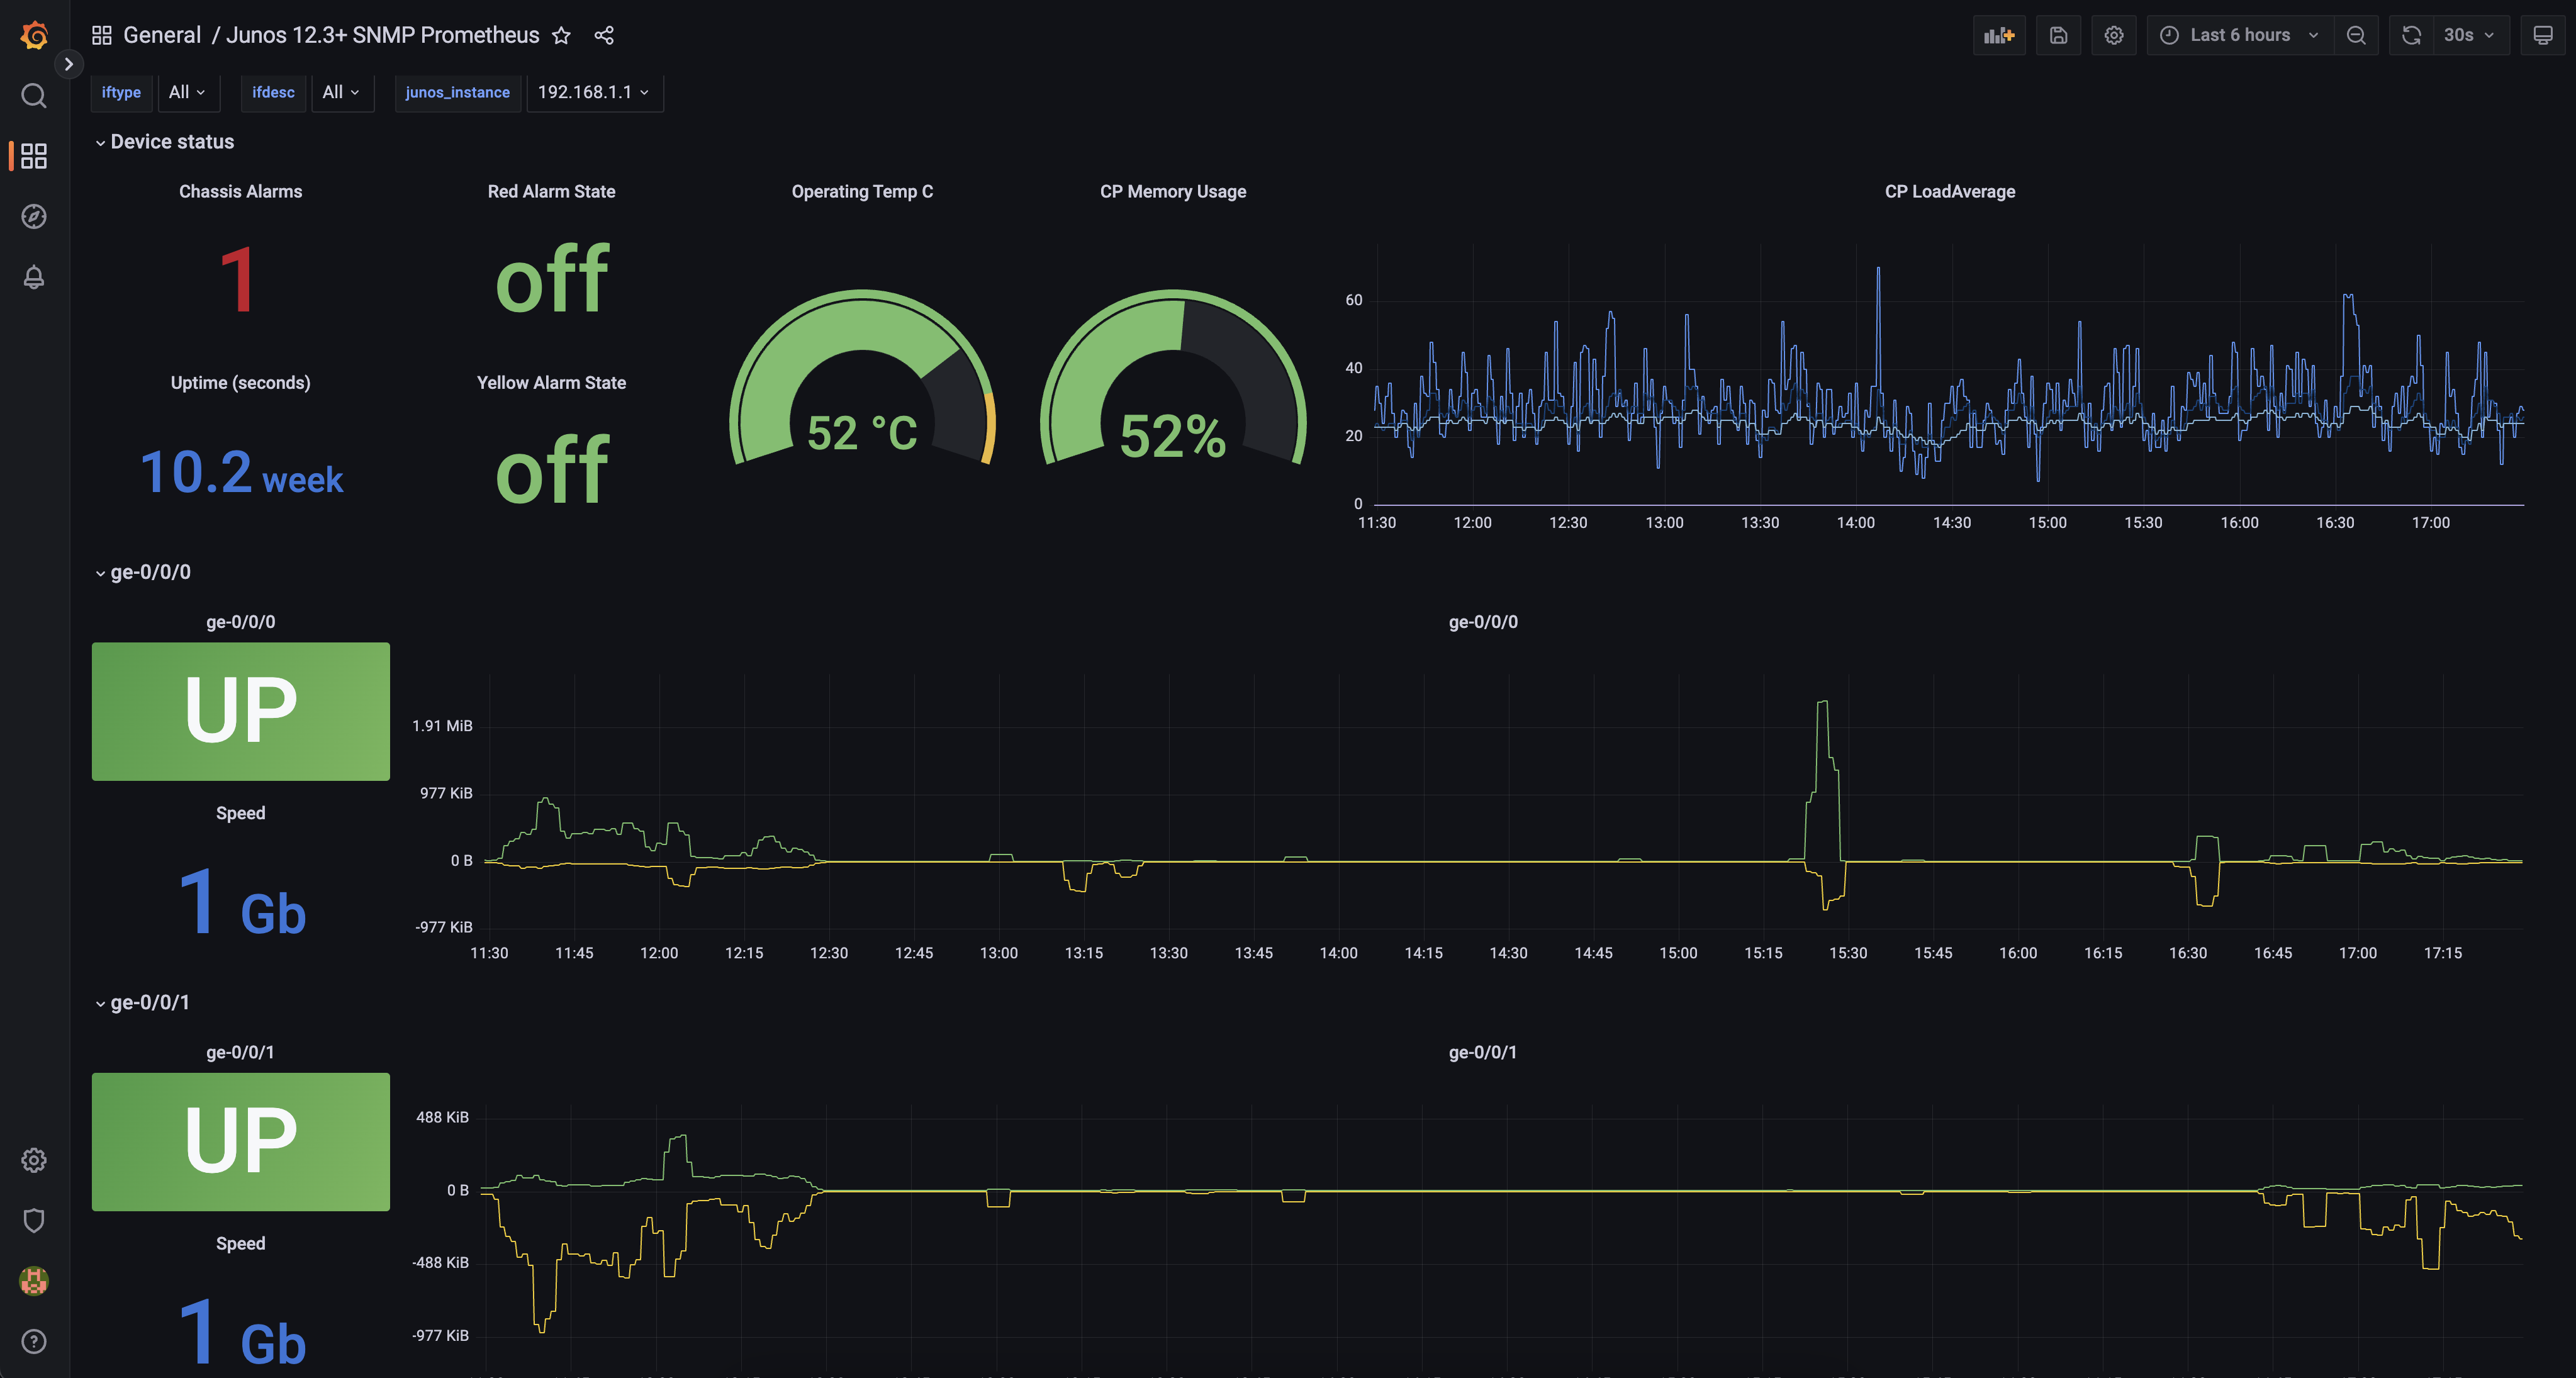
Juniper networks hardware metrics scrape with Prometheus SNMP exporter. Device overview including alarms and interface state with speed and in/out bandwidth trends. Tested with SRX equipment.
More detail here : https://www.paulerrington.co.uk/blog/2025/06/29/srx-snmp-prometheus.html
HOWTO:
Install prometheus-snmp-exporter (tested working on 0.19.0).
Download the MIBS from juniper networks to /usr/share/snmp/mibs.
Setup a generate.yml.
modules:
  srx220h2:
    version: 2
    auth:
      community: "homelab"     # or your SNMPv2c community
    walk:
      - sysUpTime
      - jnxRedAlarmState
      - jnxYellowAlarmState
      - ifTable
      - ifXTable
      - jnxOperatingTable               # chassis temps, CPU, memory
      - jnxJsSPUMonitoringObjectsTable  # SRX session & SPU stats
    lookups:
      - source_indexes: [ifIndex]
        lookup: ifDescr
      - source_indexes: [ifIndex]
        lookup: ifAlias
Run the '/usr/bin/prometheus-snmp-generator generate' to output working snmp.yml
start the prometheus-snmp-exporter.
Setup your Prometheus config with the job :
prometheus.yml
  - job_name: 'junos_switches'
    scrape_interval: 60s
    scrape_timeout: 30s  # slightly longer than SNMP exporter timeout
    metrics_path: /snmp
    params:
      module:
        - srx220h2
    file_sd_configs:
      - files:
          - 'file_sd/junos_targets.yml'
    relabel_configs:
      - source_labels: [__address__]
        target_label: __param_target
      - source_labels: [__param_target]
        target_label: instance
      - target_label: __address__
        replacement: 127.0.0.1:9116
- Setup your instances file :
file_sd/junos_targets.yml
- targets:
    - '192.168.1.1'
  labels:
    site: 'DC1'
    model: 'SRX220H2'
    vendor: 'juniper'
- Reload Prometheus and you should see metrics collecting for the target.
Data source config
Collector config:
Upload an updated version of an exported dashboard.json file from Grafana
| Revision | Description | Created | |
|---|---|---|---|
| Download |
Metrics Endpoint (Prometheus)
Easily monitor any Prometheus-compatible and publicly accessible metrics URL with Grafana Cloud's out-of-the-box monitoring solution.
Learn more