AdGuard Metrics Statistics
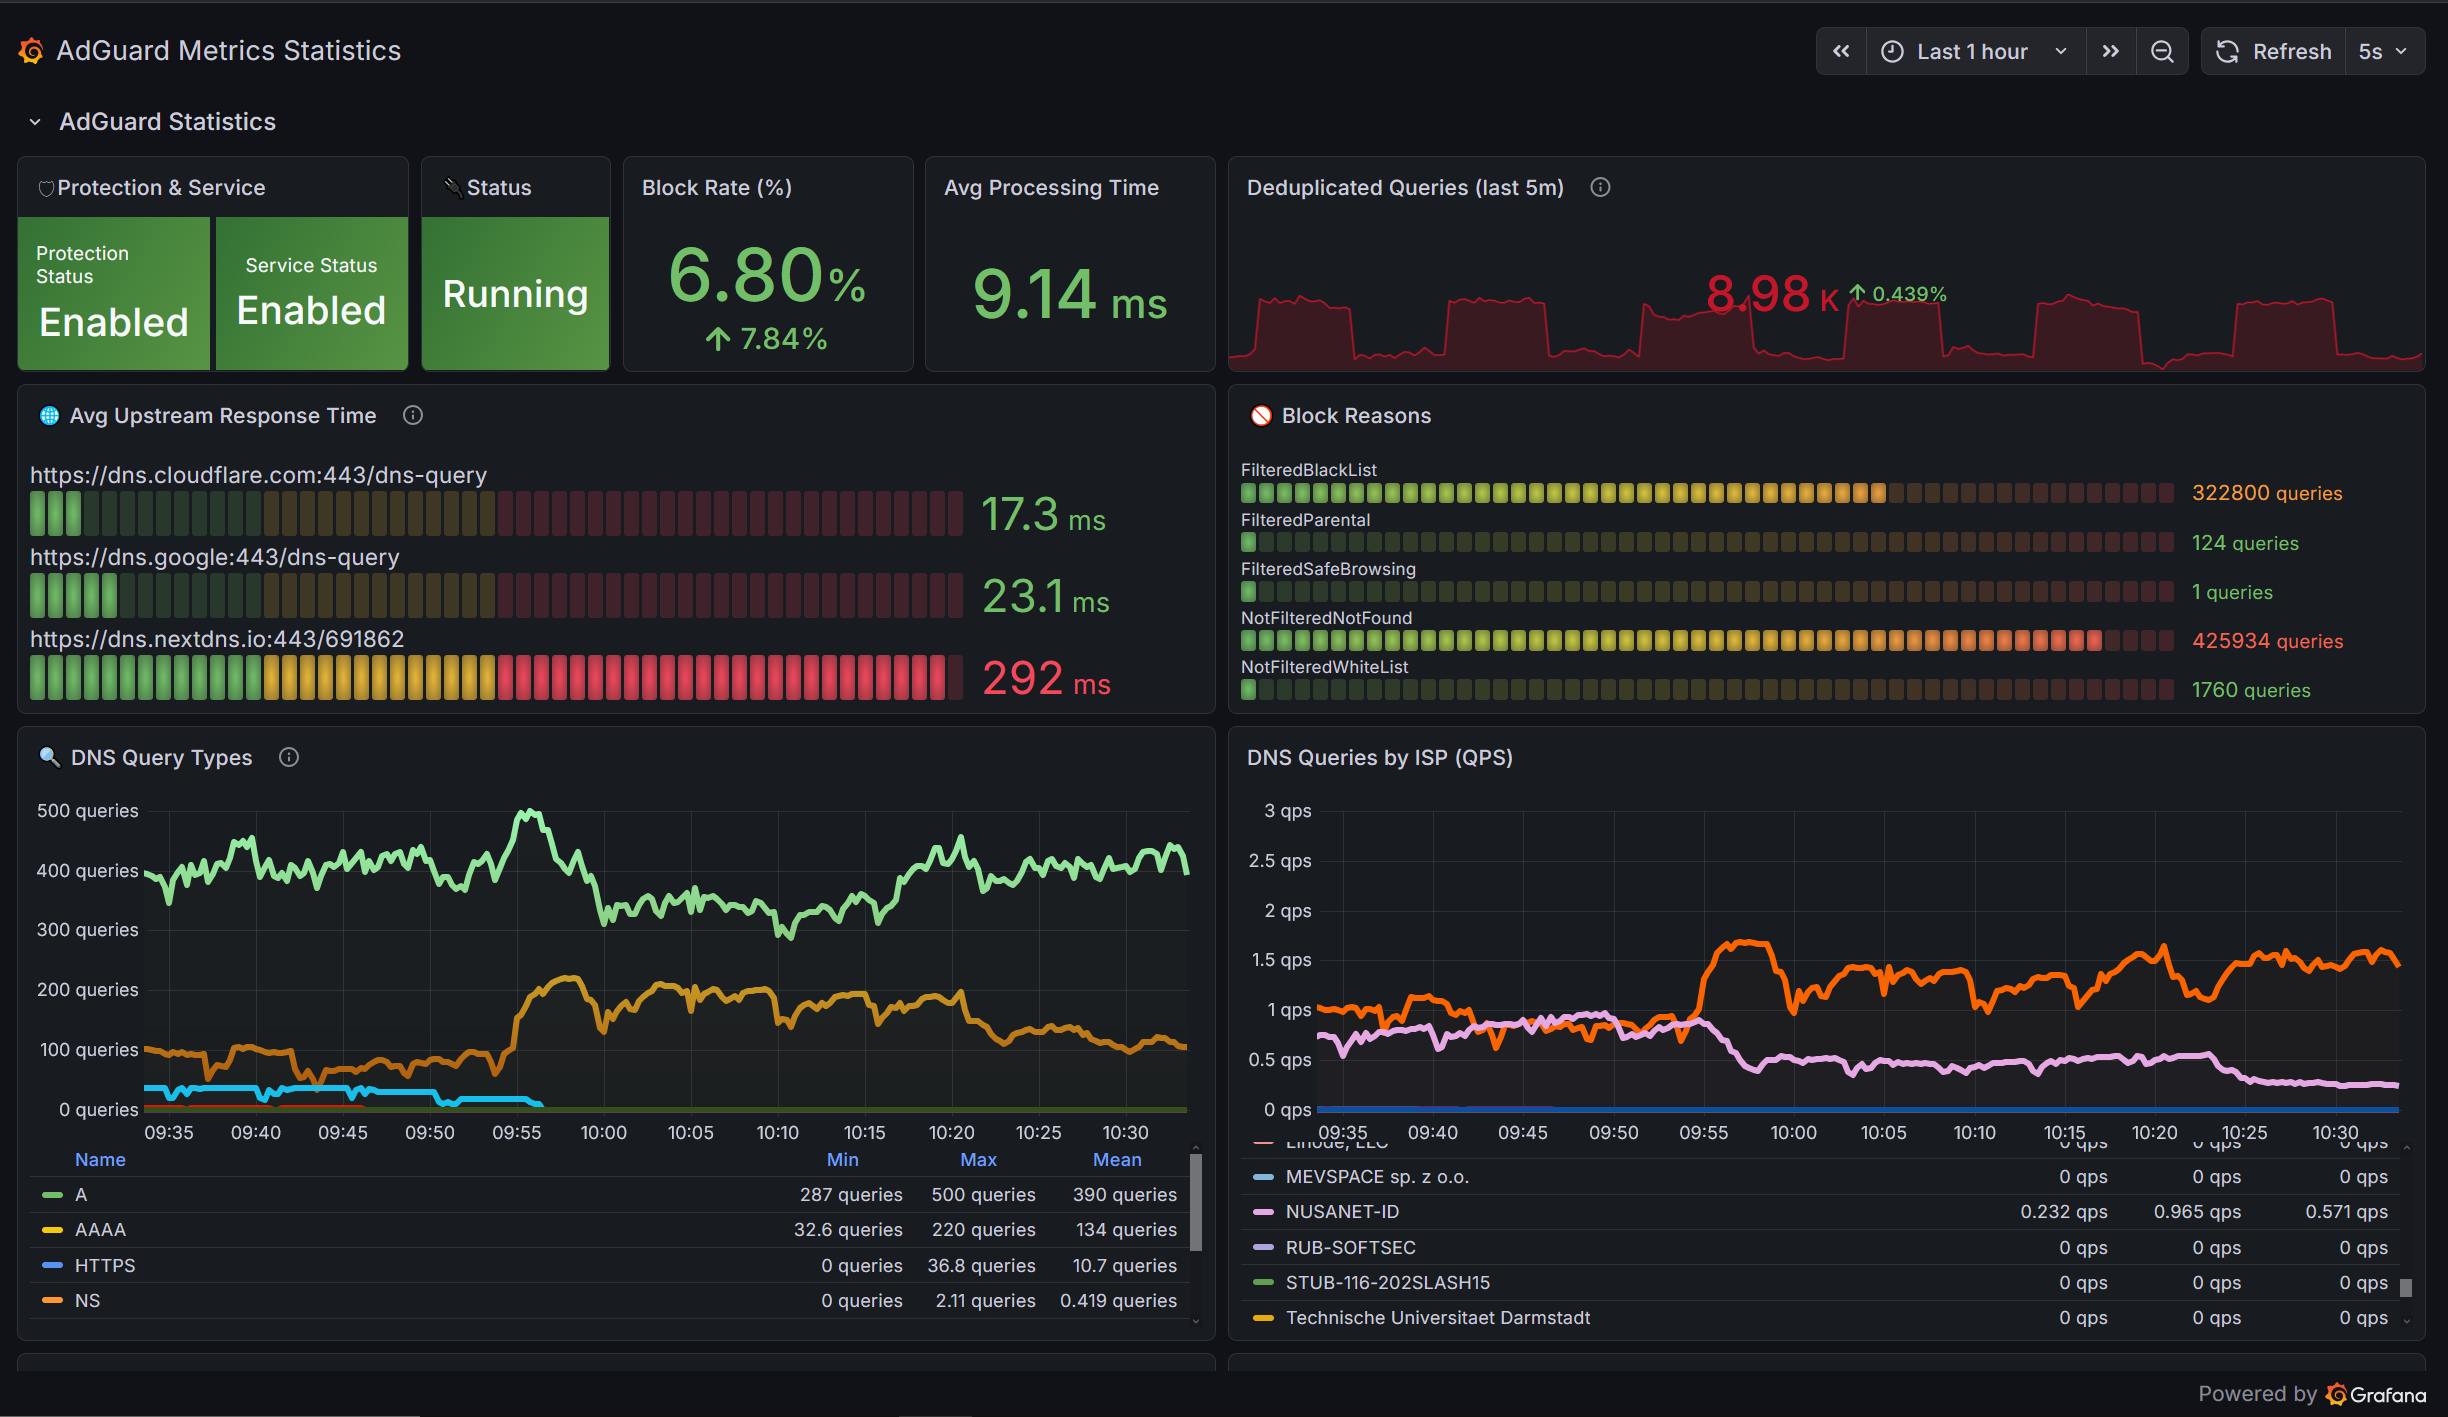
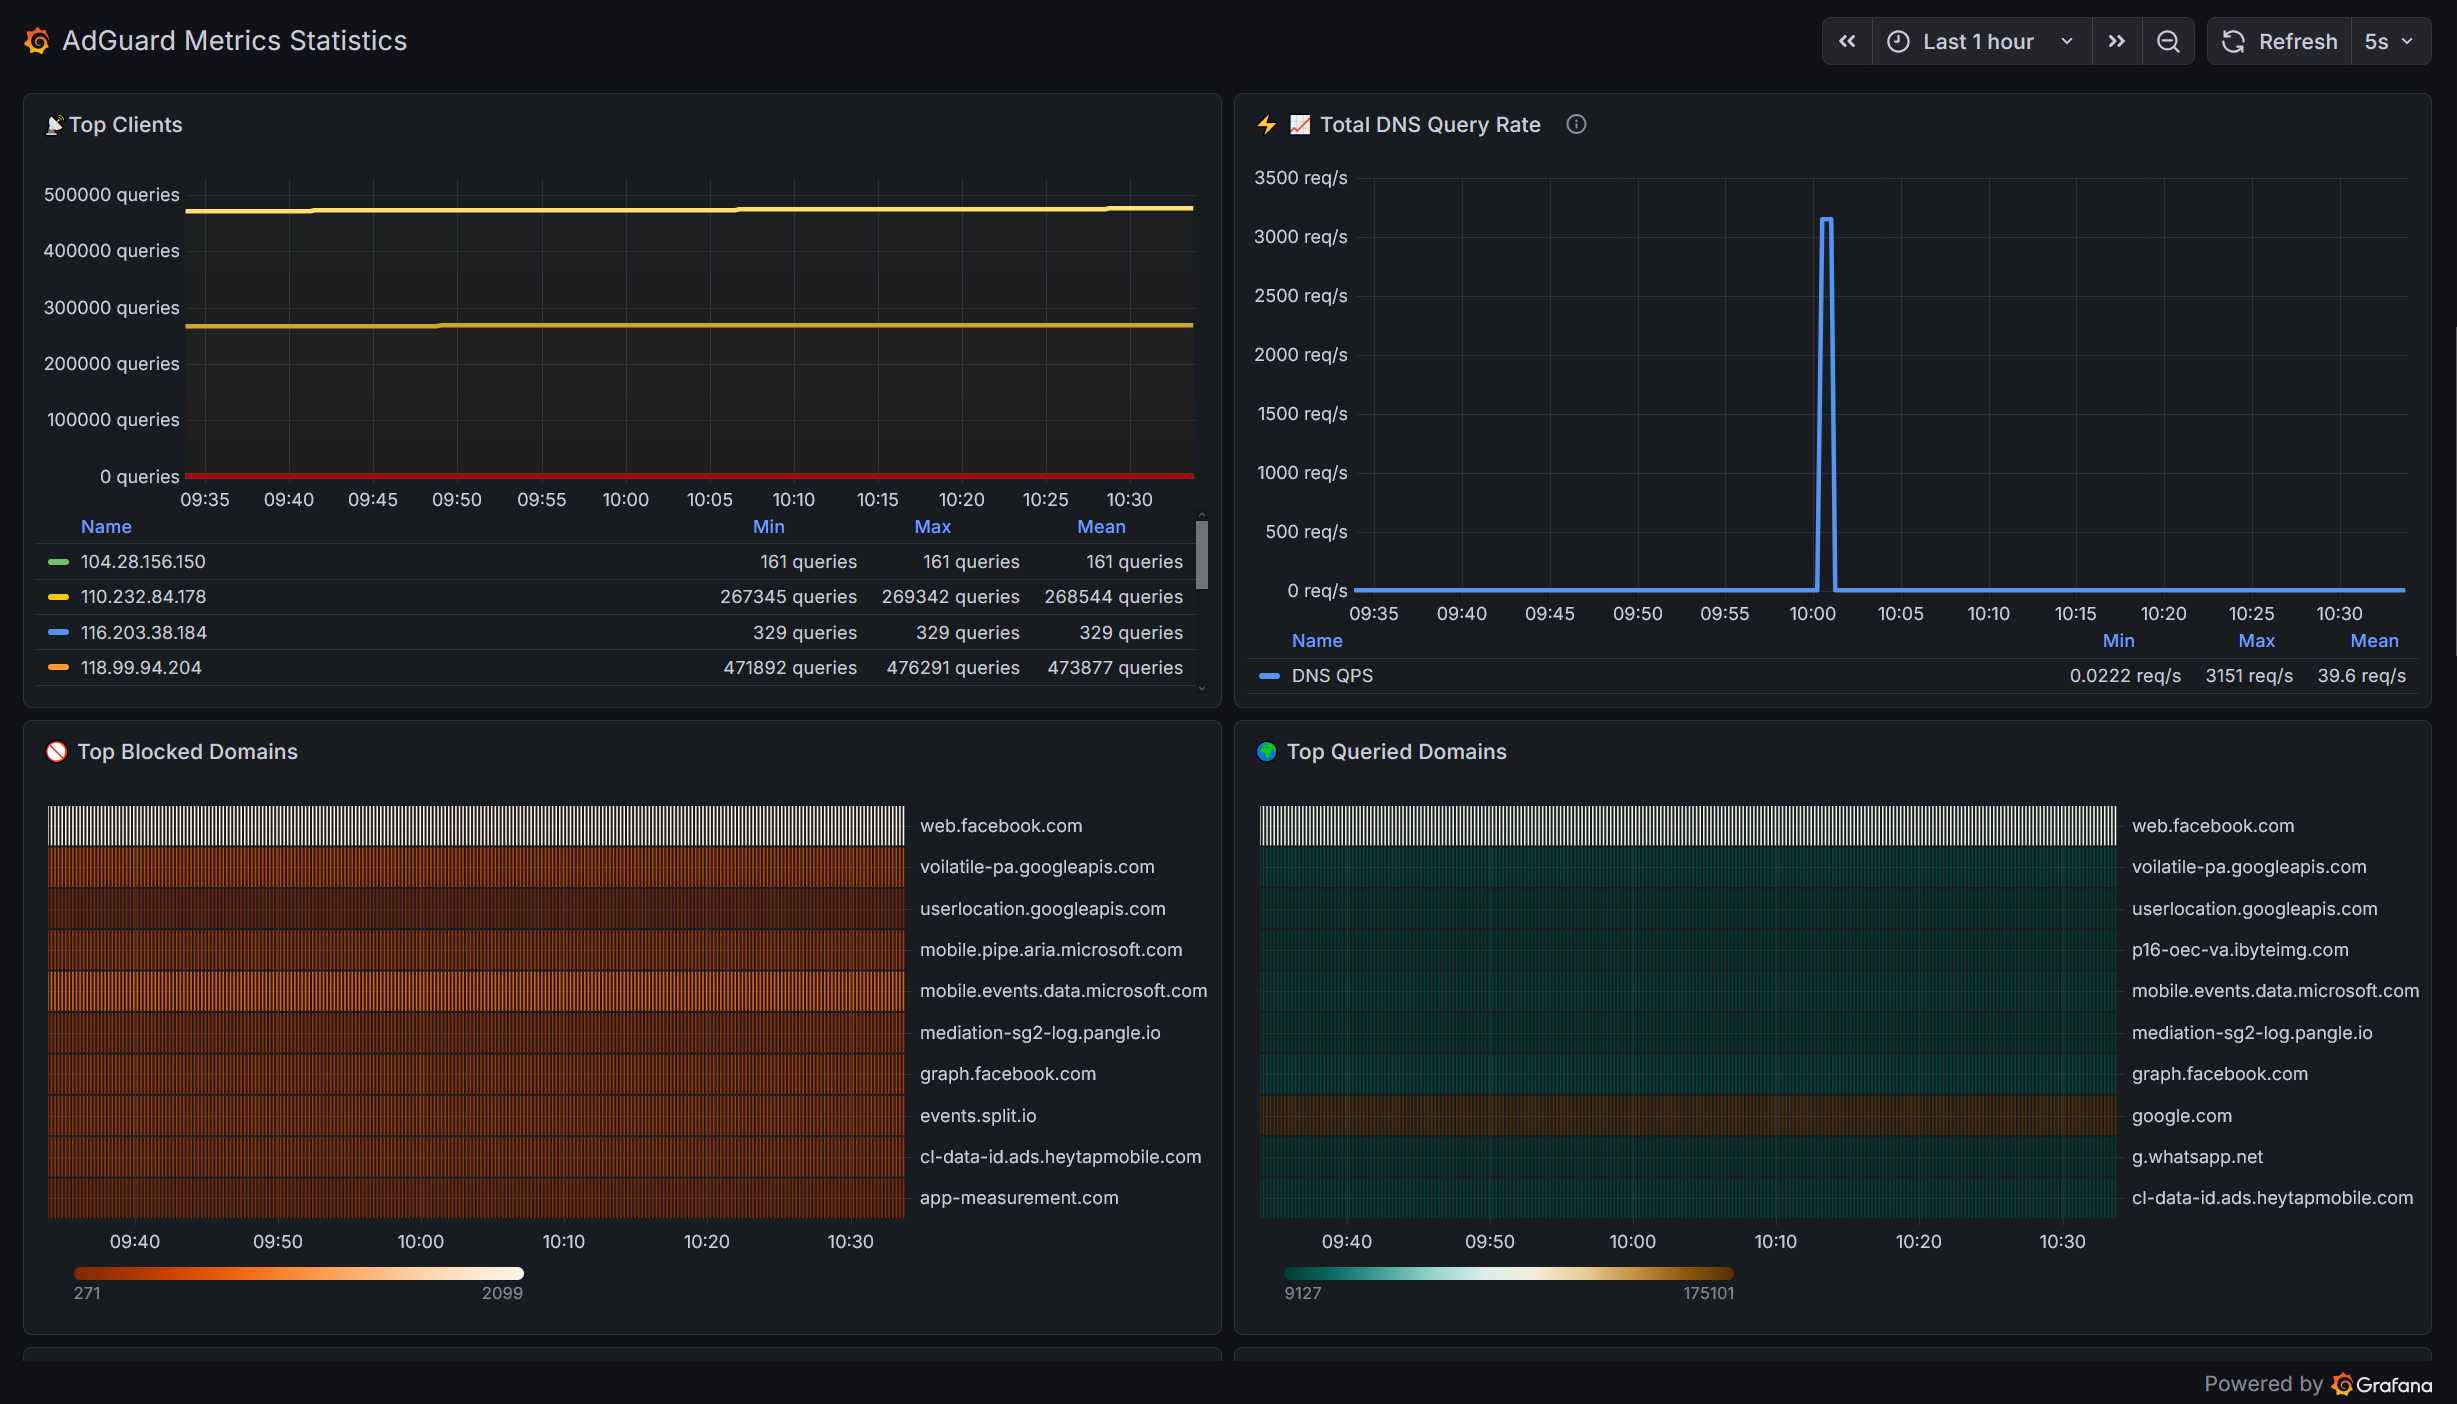
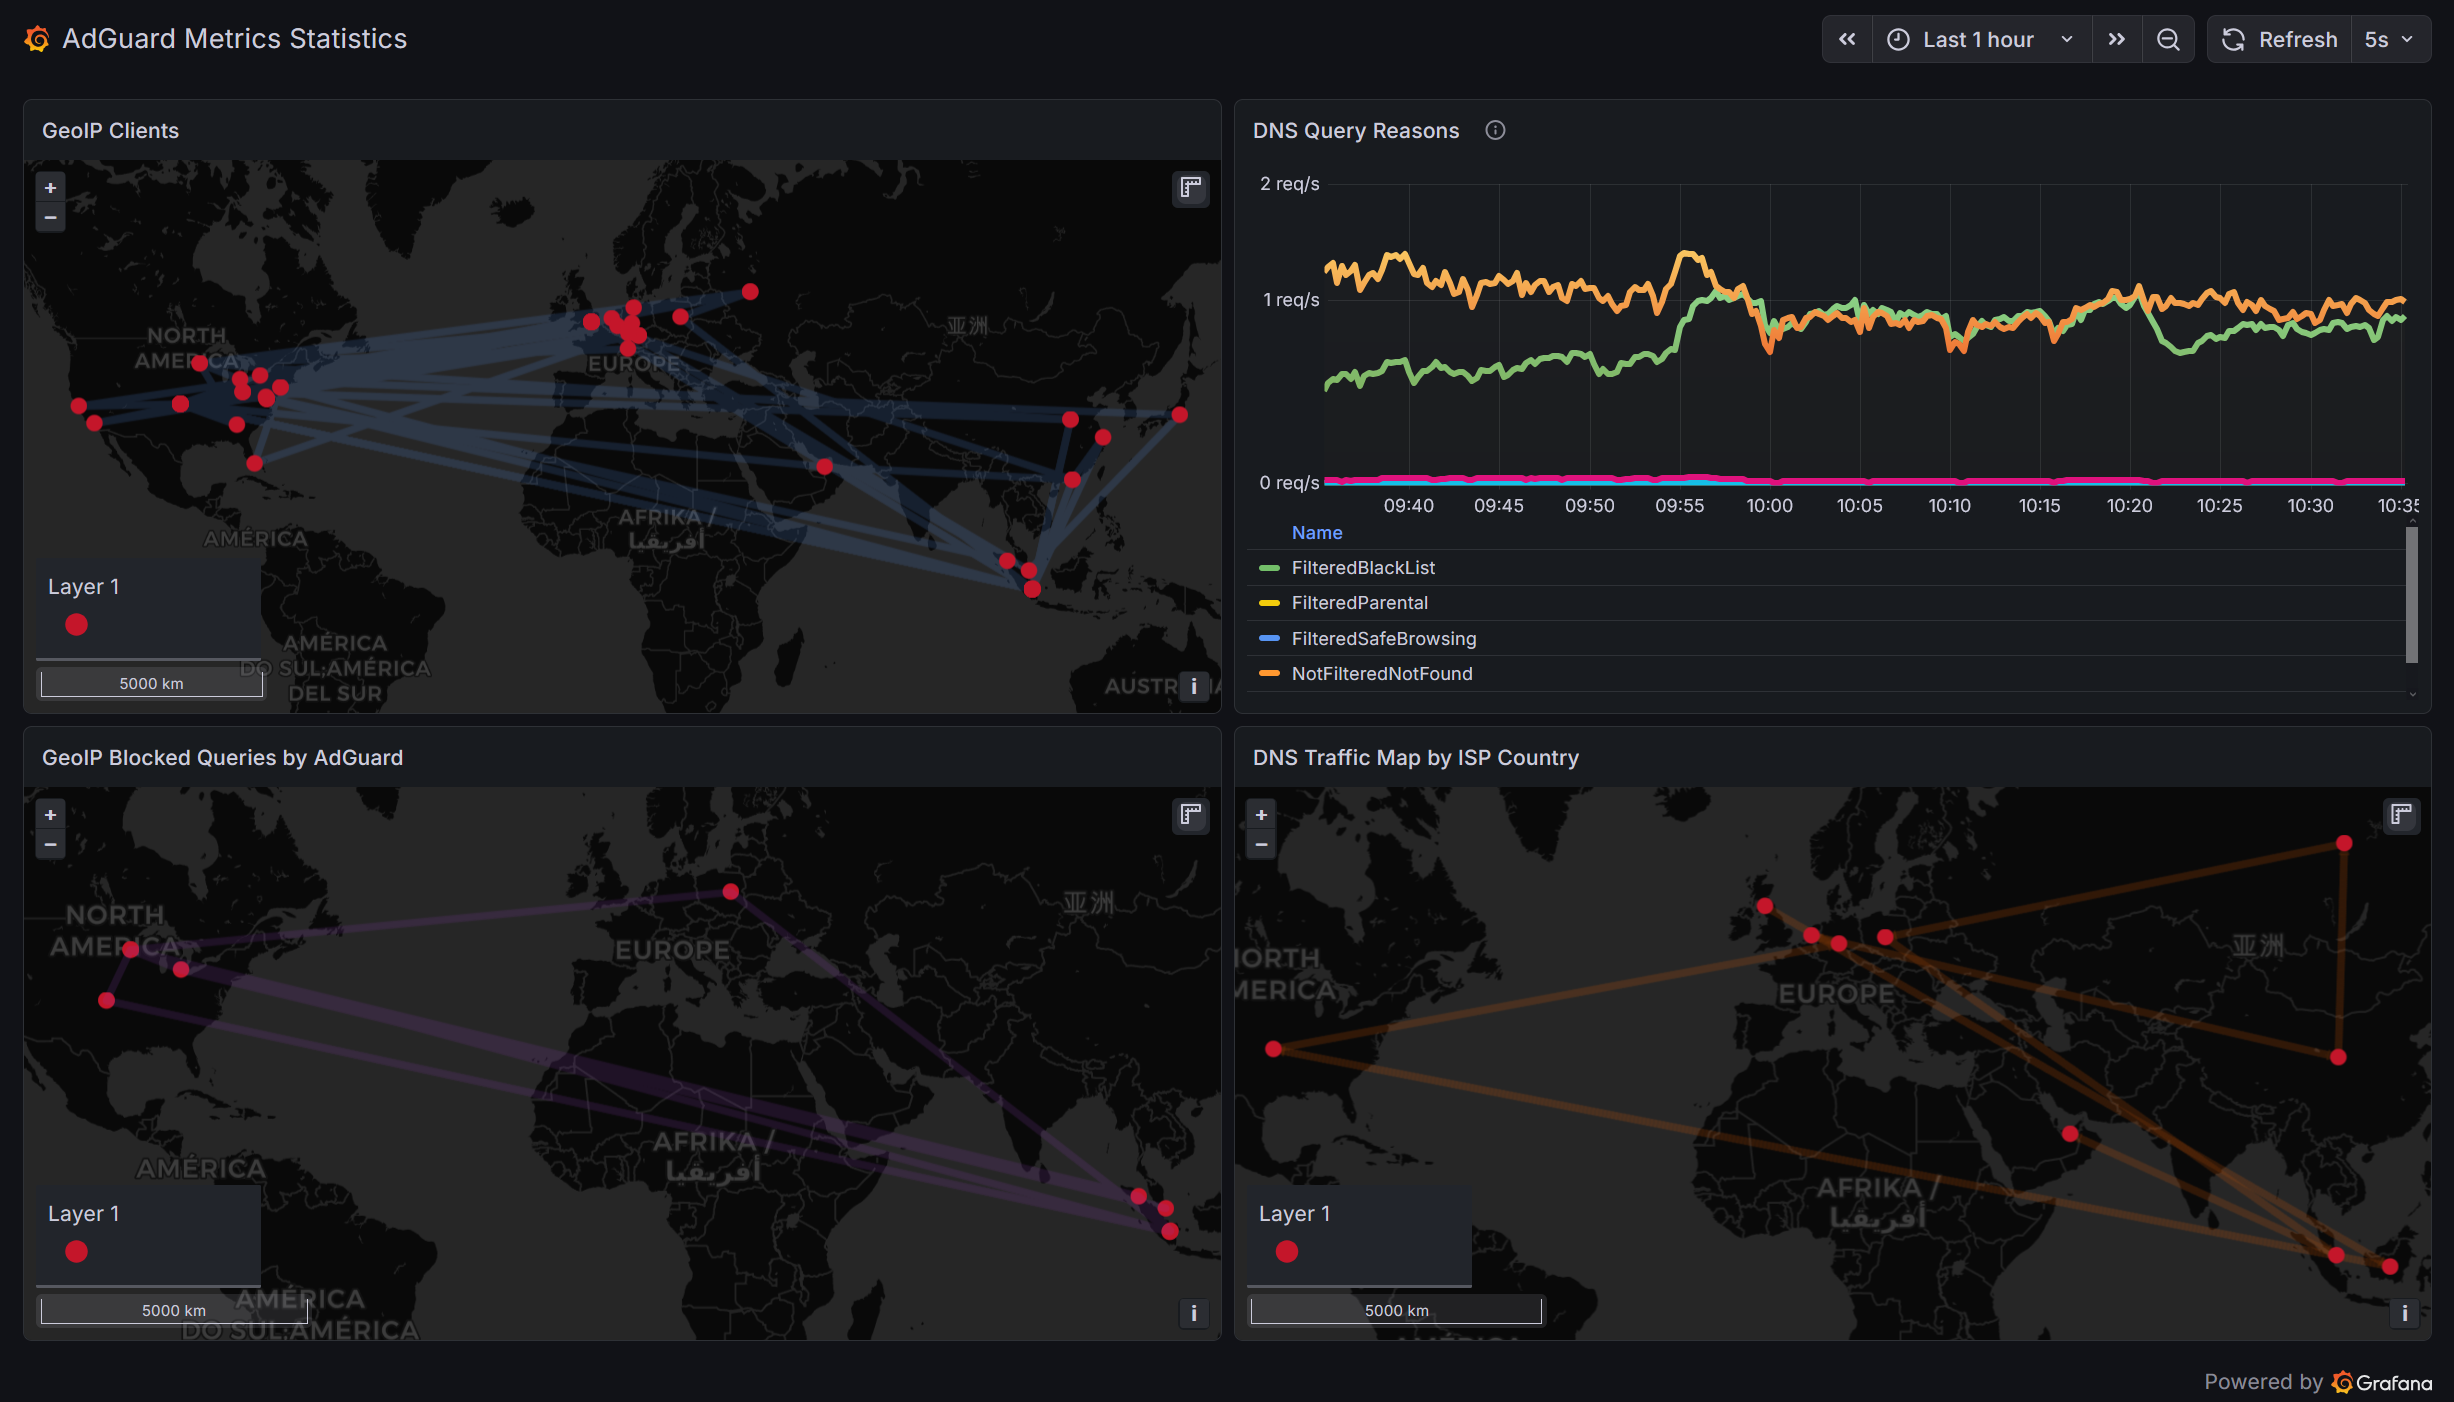
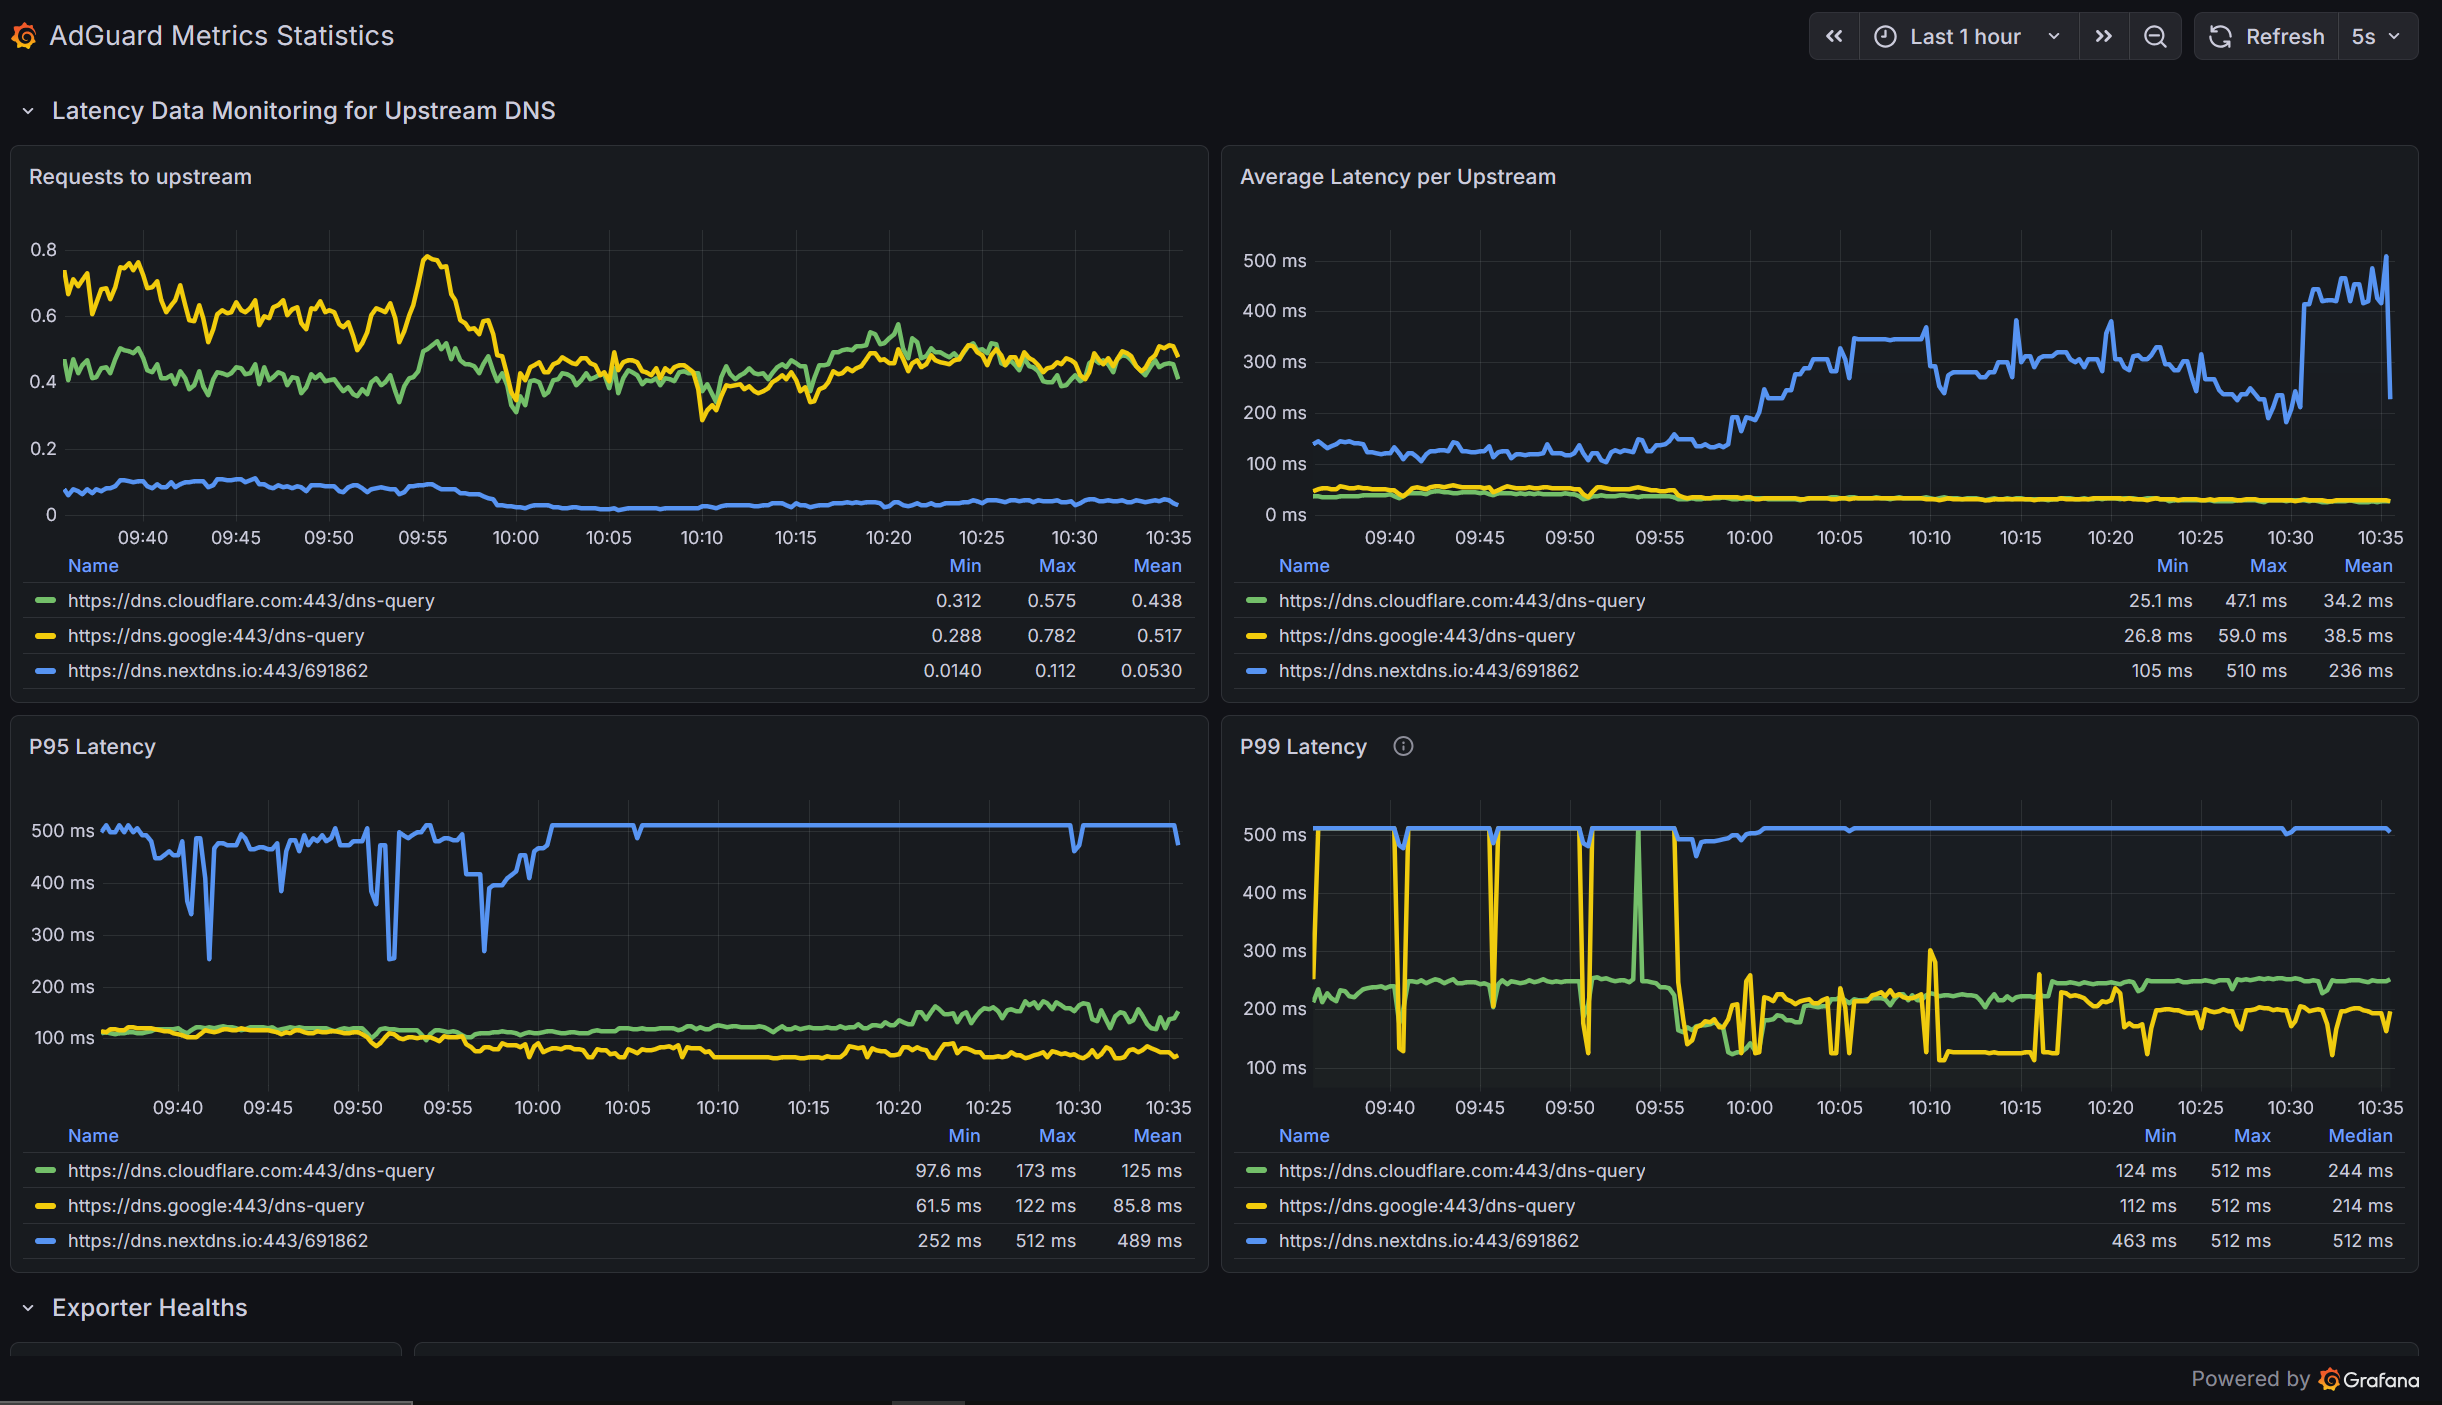
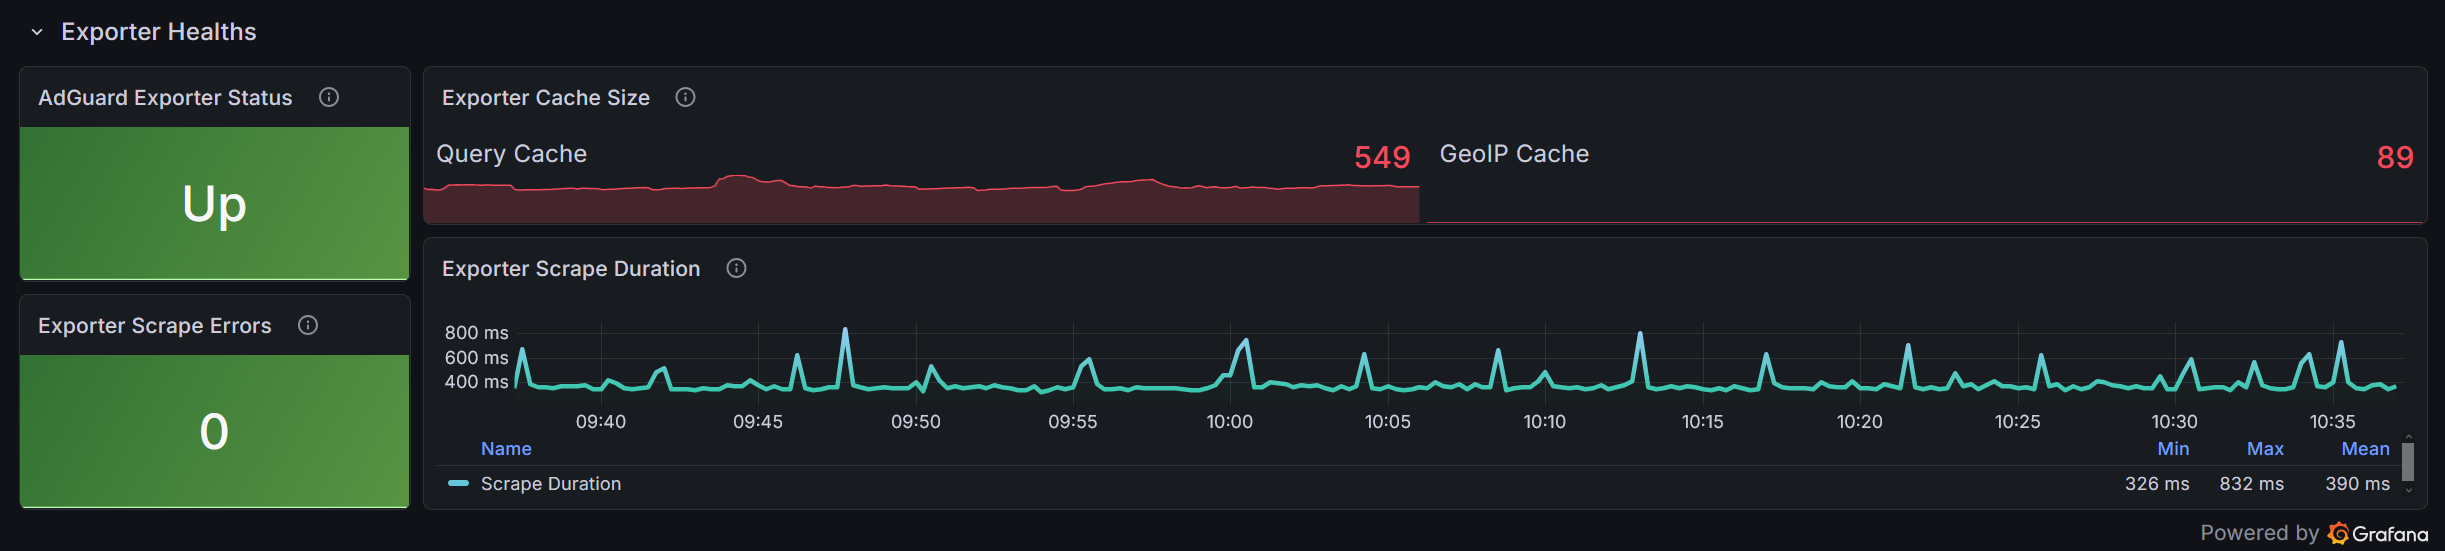
Grafana panels for AdGuard metrics
AdGuard Exporter for Prometheus
A lightweight Prometheus exporter written in Go that exposes detailed metrics from your AdGuard Home instance — including DNS statistics, blocked domains, upstreams, and client data.
Features
| Category | Capabilities |
|---|---|
| API Integration | • Authenticated access to AdGuard Home API • Supports /control/status, /control/stats, and /control/querylog endpoints |
| DNS Analytics | • Total DNS queries metrics • Blocked DNS queries tracking • Upstream DNS statistics • Per-client query statistics • Query reason statistics • DNS upstream latency histograms |
| Query Log Processing | • Real-time query log analysis • Query deduplication to prevent metric inflation • Domain and query reason tracking |
| GeoIP Enrichment | • MaxMind GeoLite2 IP geolocation lookup • DNS client geographic visualization (Grafana Geomap) • DNS threat map for blocked queries • GeoIP caching for improved performance |
| Traffic Analytics | • DNS queries grouped by ISP organization • Country-level DNS traffic insights • ISP-based DNS traffic monitoring |
| Exporter Monitoring | • Deduplication cache metrics • GeoIP cache usage monitoring • Deduplication hit counters • Exporter scrape performance metrics |
| Deployment | • Customizable scrape interval • Lightweight single binary deployment • Docker-friendly deployment |
Deployment
For installation guides, configuration examples, Docker usage, and source code, visit this github repository:
https://github.com/znandev/adguardexporter
Data source config
Collector type:
Collector plugins:
Collector config:
Revisions
Upload an updated version of an exported dashboard.json file from Grafana
| Revision | Description | Created | |
|---|---|---|---|
| Download |