Nebius Managed Postgres
Grafana dashboard for monitoring a Nebius Managed Postgres cluster
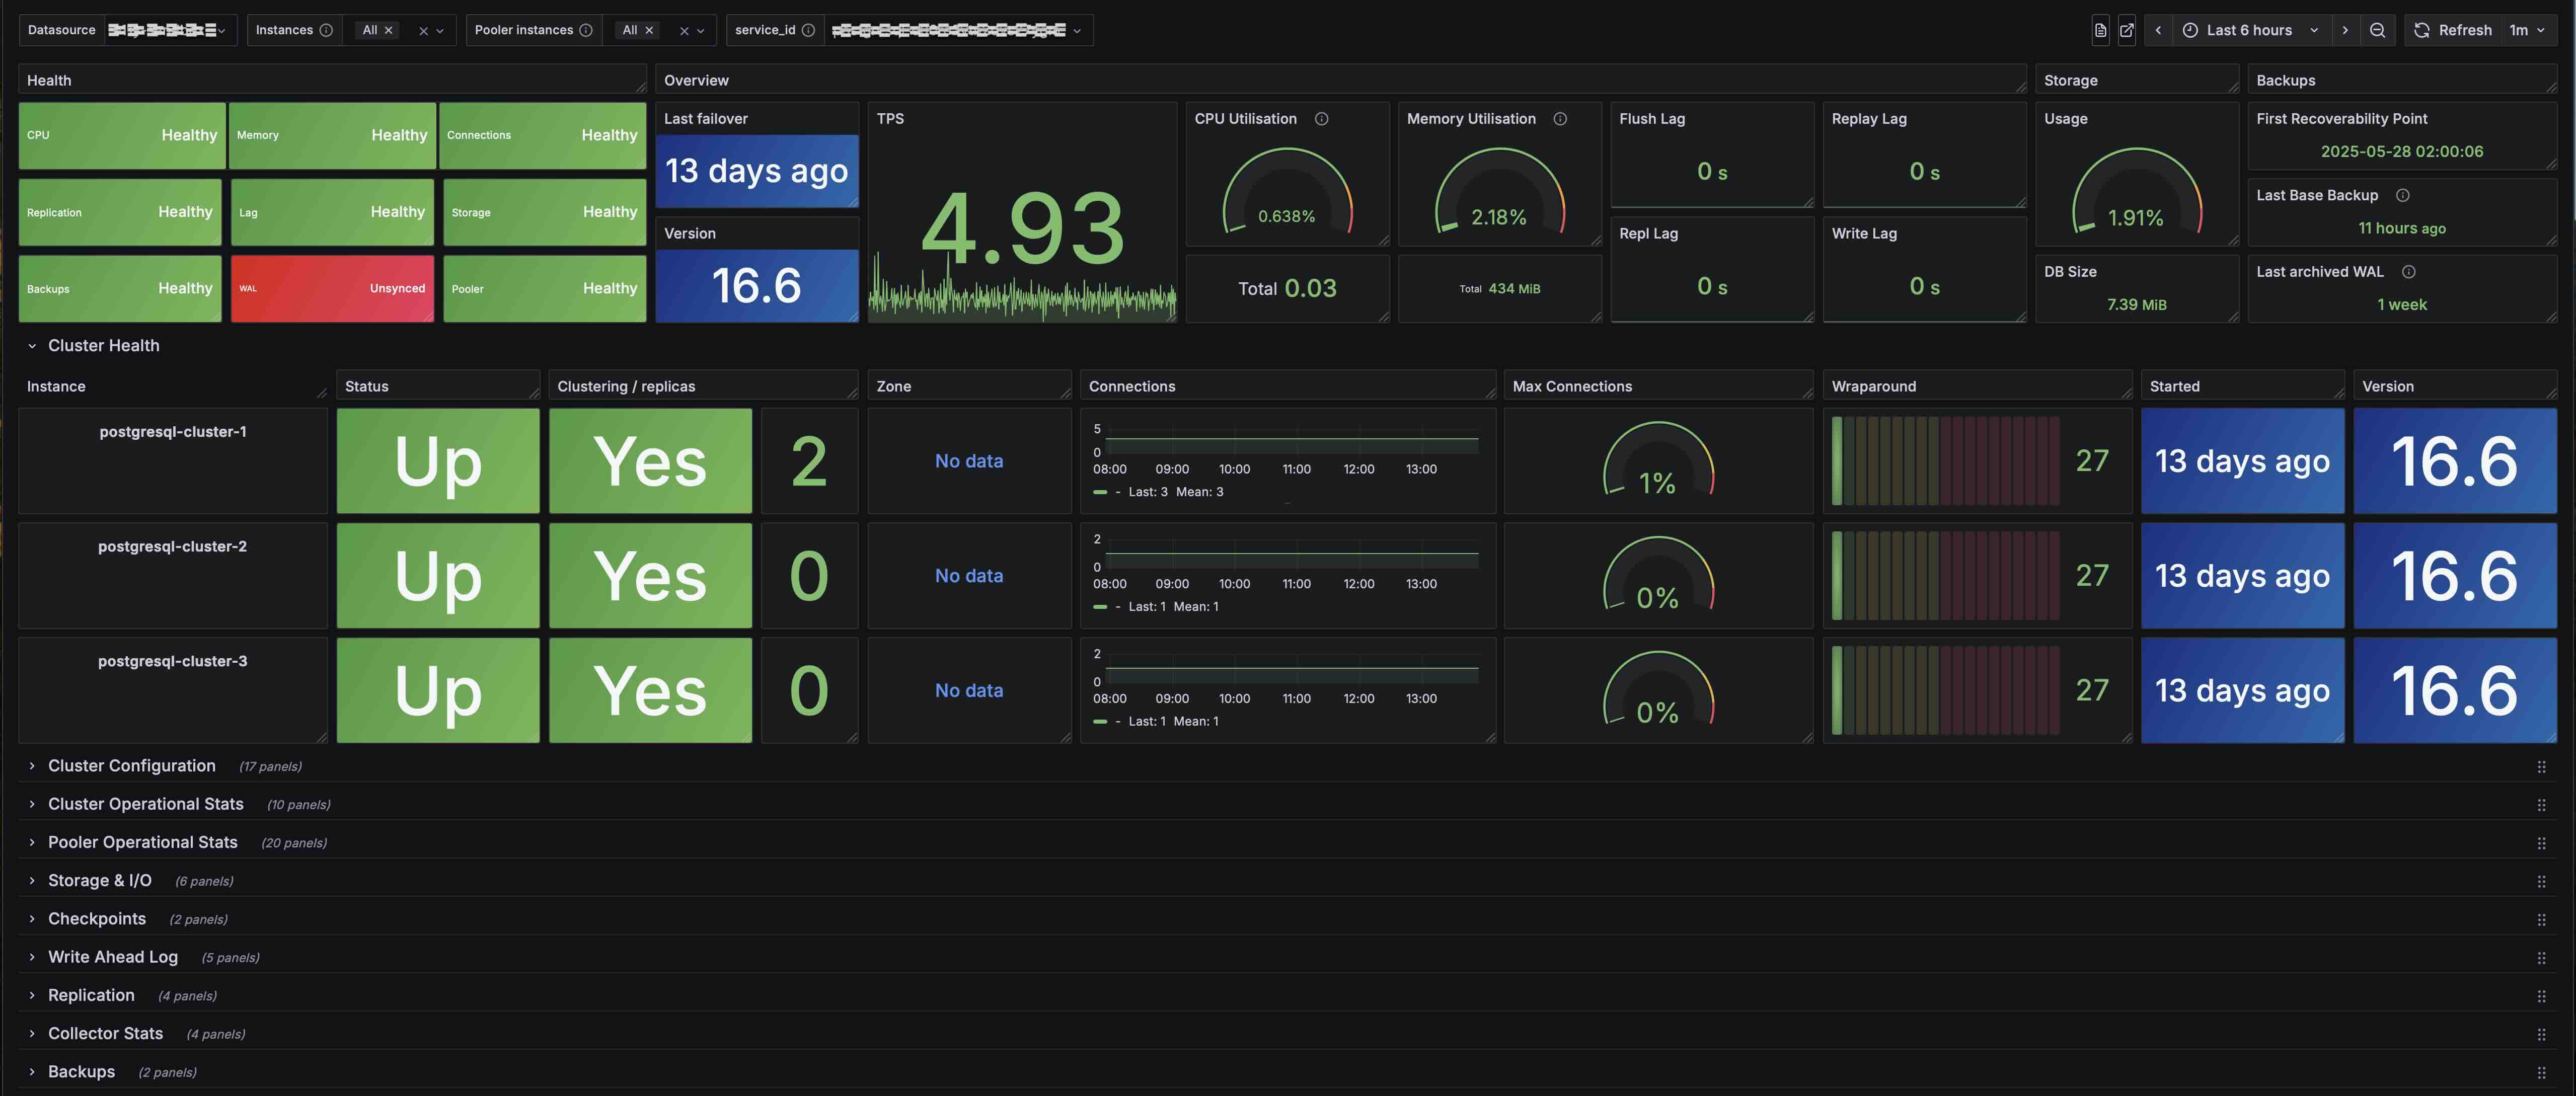
A detailed description of all the metrics displayed on the dashboard can be found in our documentation. https://docs.nebius.com/postgresql/monitoring
Data source config
Collector type:
Collector plugins:
Collector config:
Revisions
Upload an updated version of an exported dashboard.json file from Grafana
| Revision | Description | Created | |
|---|---|---|---|
| Download |
PostgreSQL
Easily monitor your deployment of PostgreSQL, the open source relational database, with Grafana Cloud's out-of-the-box monitoring solution.
Learn more