Longhorn Dashboard
High-level view of Longhorn - useful for monitoring, alerting and troubleshooting.
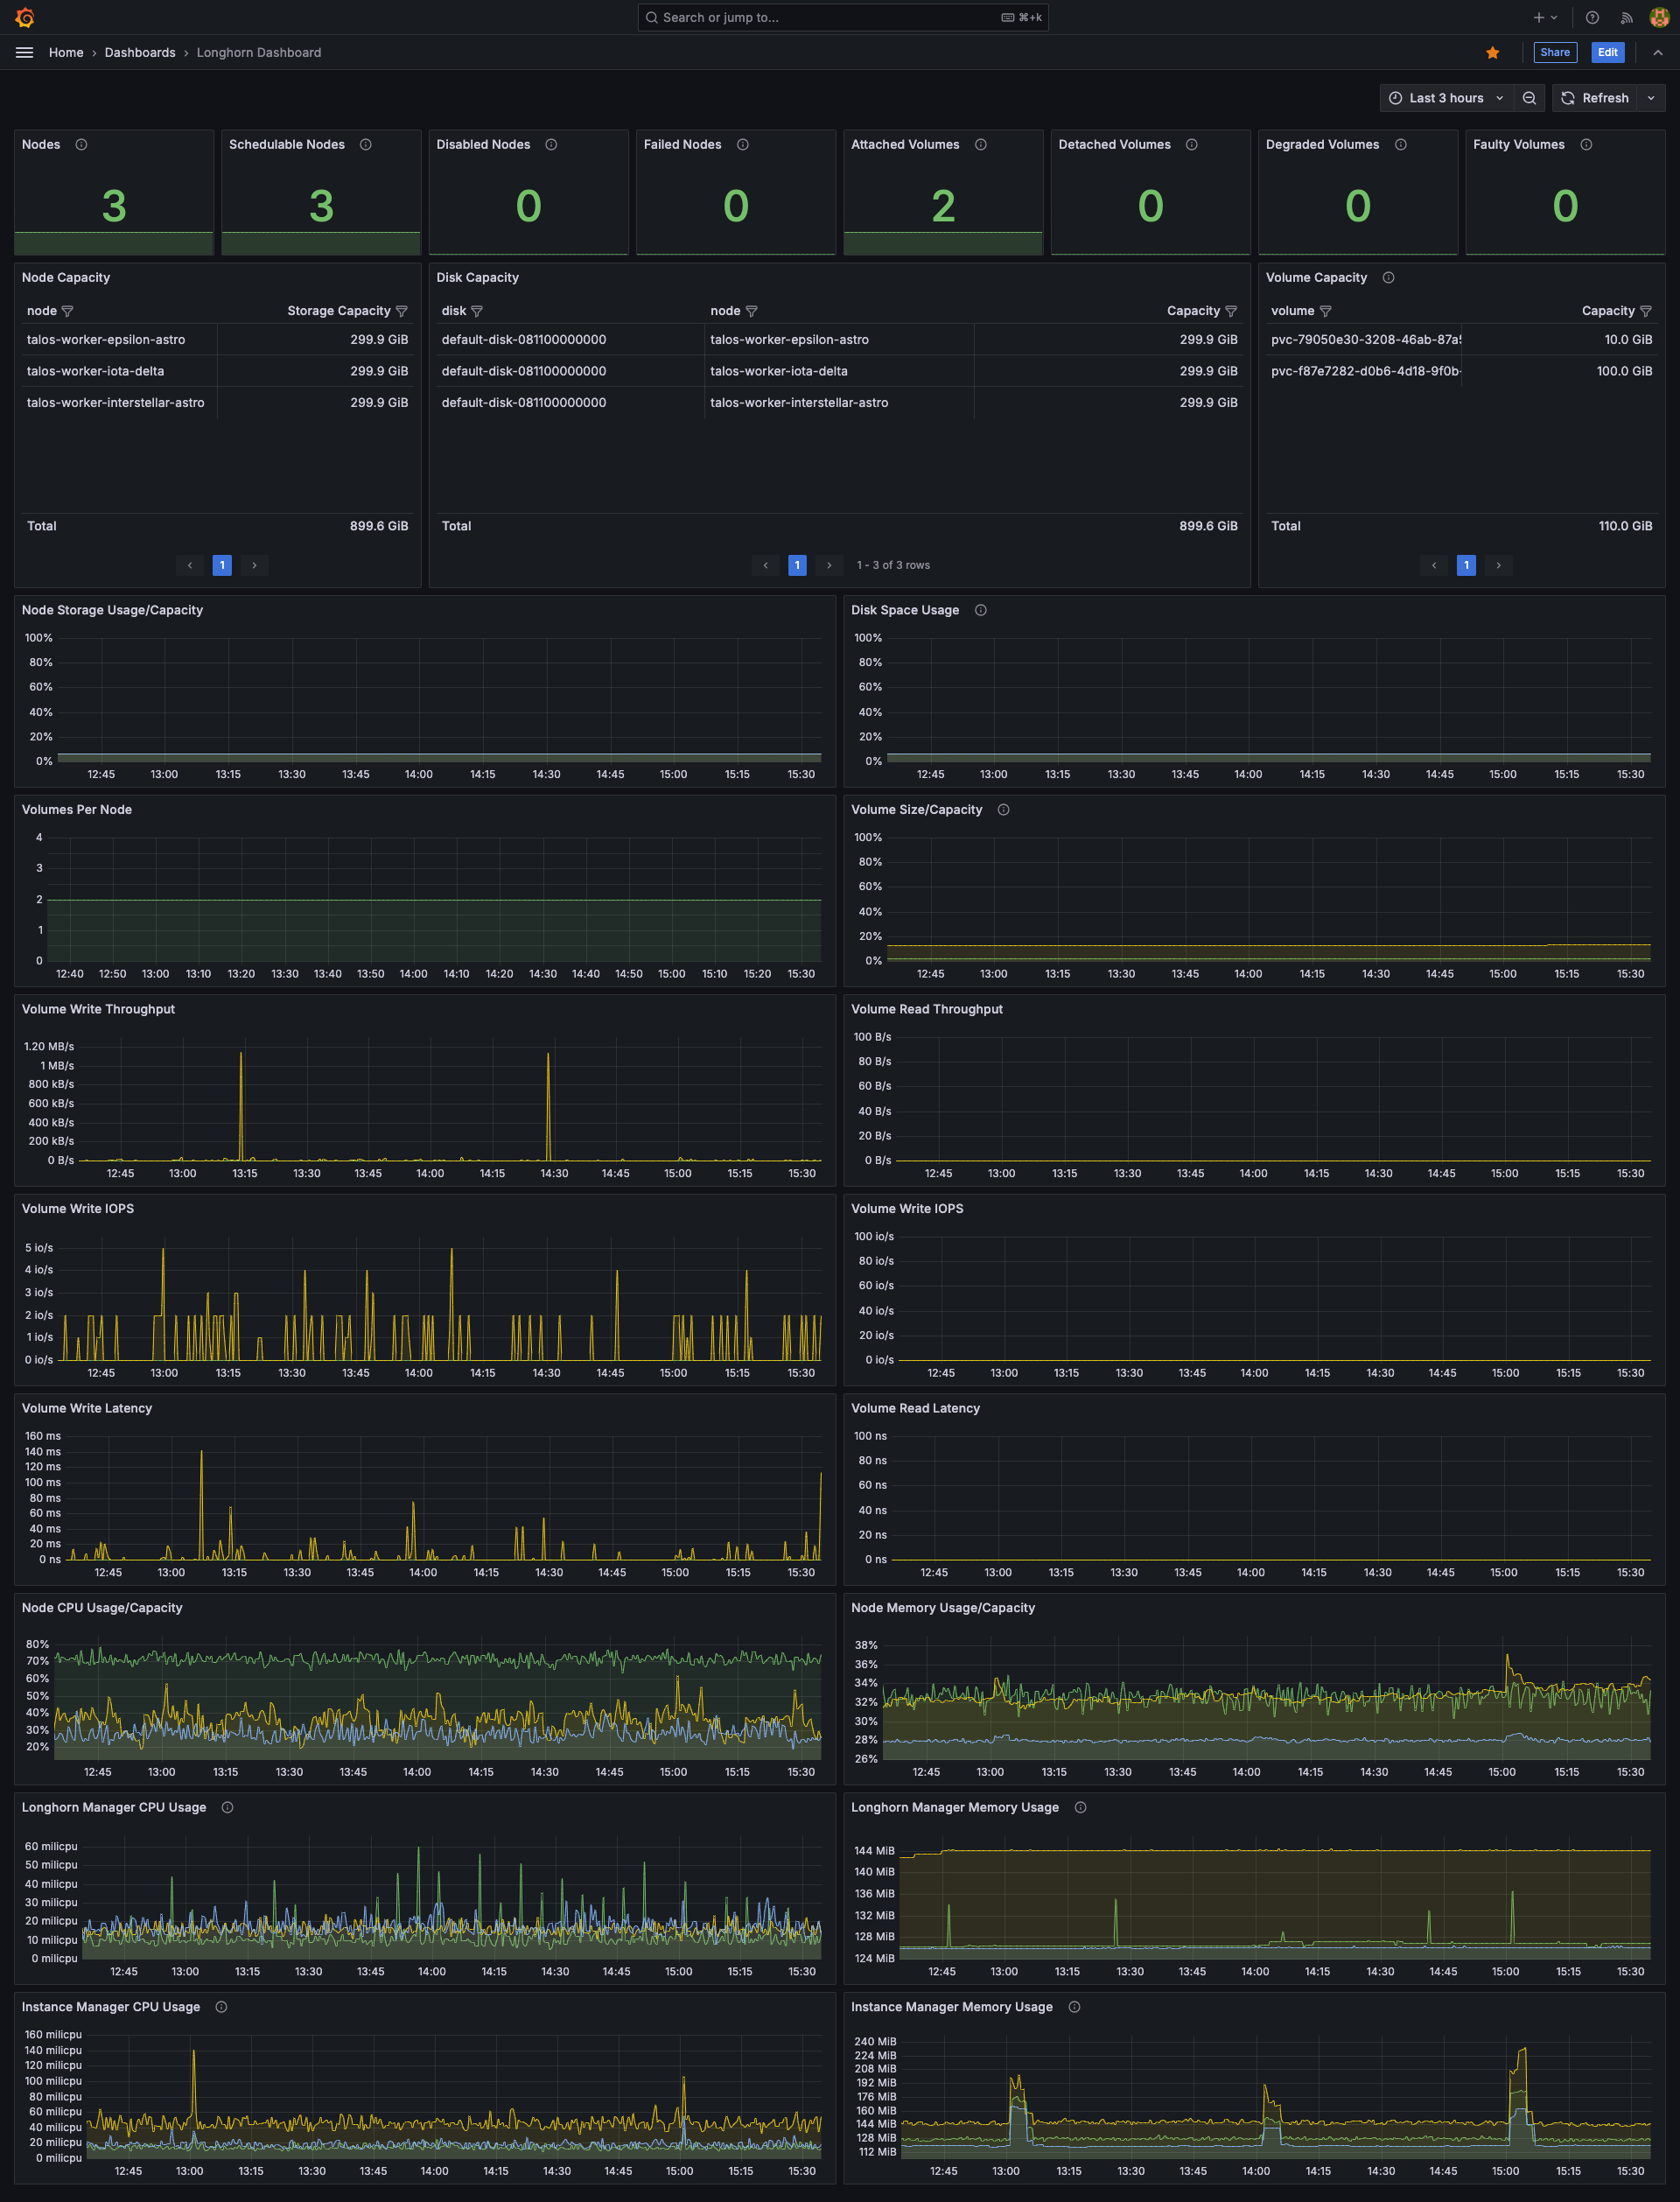
Overview High-level view of Longhorn - useful for monitoring, alerting and troubleshooting.
Works on local, bare-metal or cloud provided clusters (e.g. k3s, kind, minikube, Talos Linux, EKS etc..)
github.com/adegoodyer/grafana-dashboards
Features
- Node, disk and volume capacity
- Node storage and disk space
- Volumes per node and current capacity
- Volume read/write throughput
- Volume read/write iops
- Volume read/write latency
- Node CPU/memory
- Longhorn Manager CPU/memory
- Instance Manager CPU/memory
Contributing
Fork the repository Create your feature branch (git checkout -b feature/amazing-feature) Commit your changes (git commit -m 'Add some amazing feature') Push to the branch (git push origin feature/amazing-feature) Open a Pull Request
License This project is licensed under the MIT License - see the LICENSE file for details.
Data source config
Collector type:
Collector plugins:
Collector config:
Revisions
Upload an updated version of an exported dashboard.json file from Grafana
| Revision | Description | Created | |
|---|---|---|---|
| Download |