HLF SmartBFT Dashboard
Comprehensive monitoring dashboard for Hyperledger Fabric networks using SmartBFT consensus algorithm. Tracks view changes, transaction processing, batch metrics, and pool performance.
HLF SmartBFT Dashboard
Comprehensive monitoring dashboard for Hyperledger Fabric networks using SmartBFT consensus algorithm.
📊 Overview
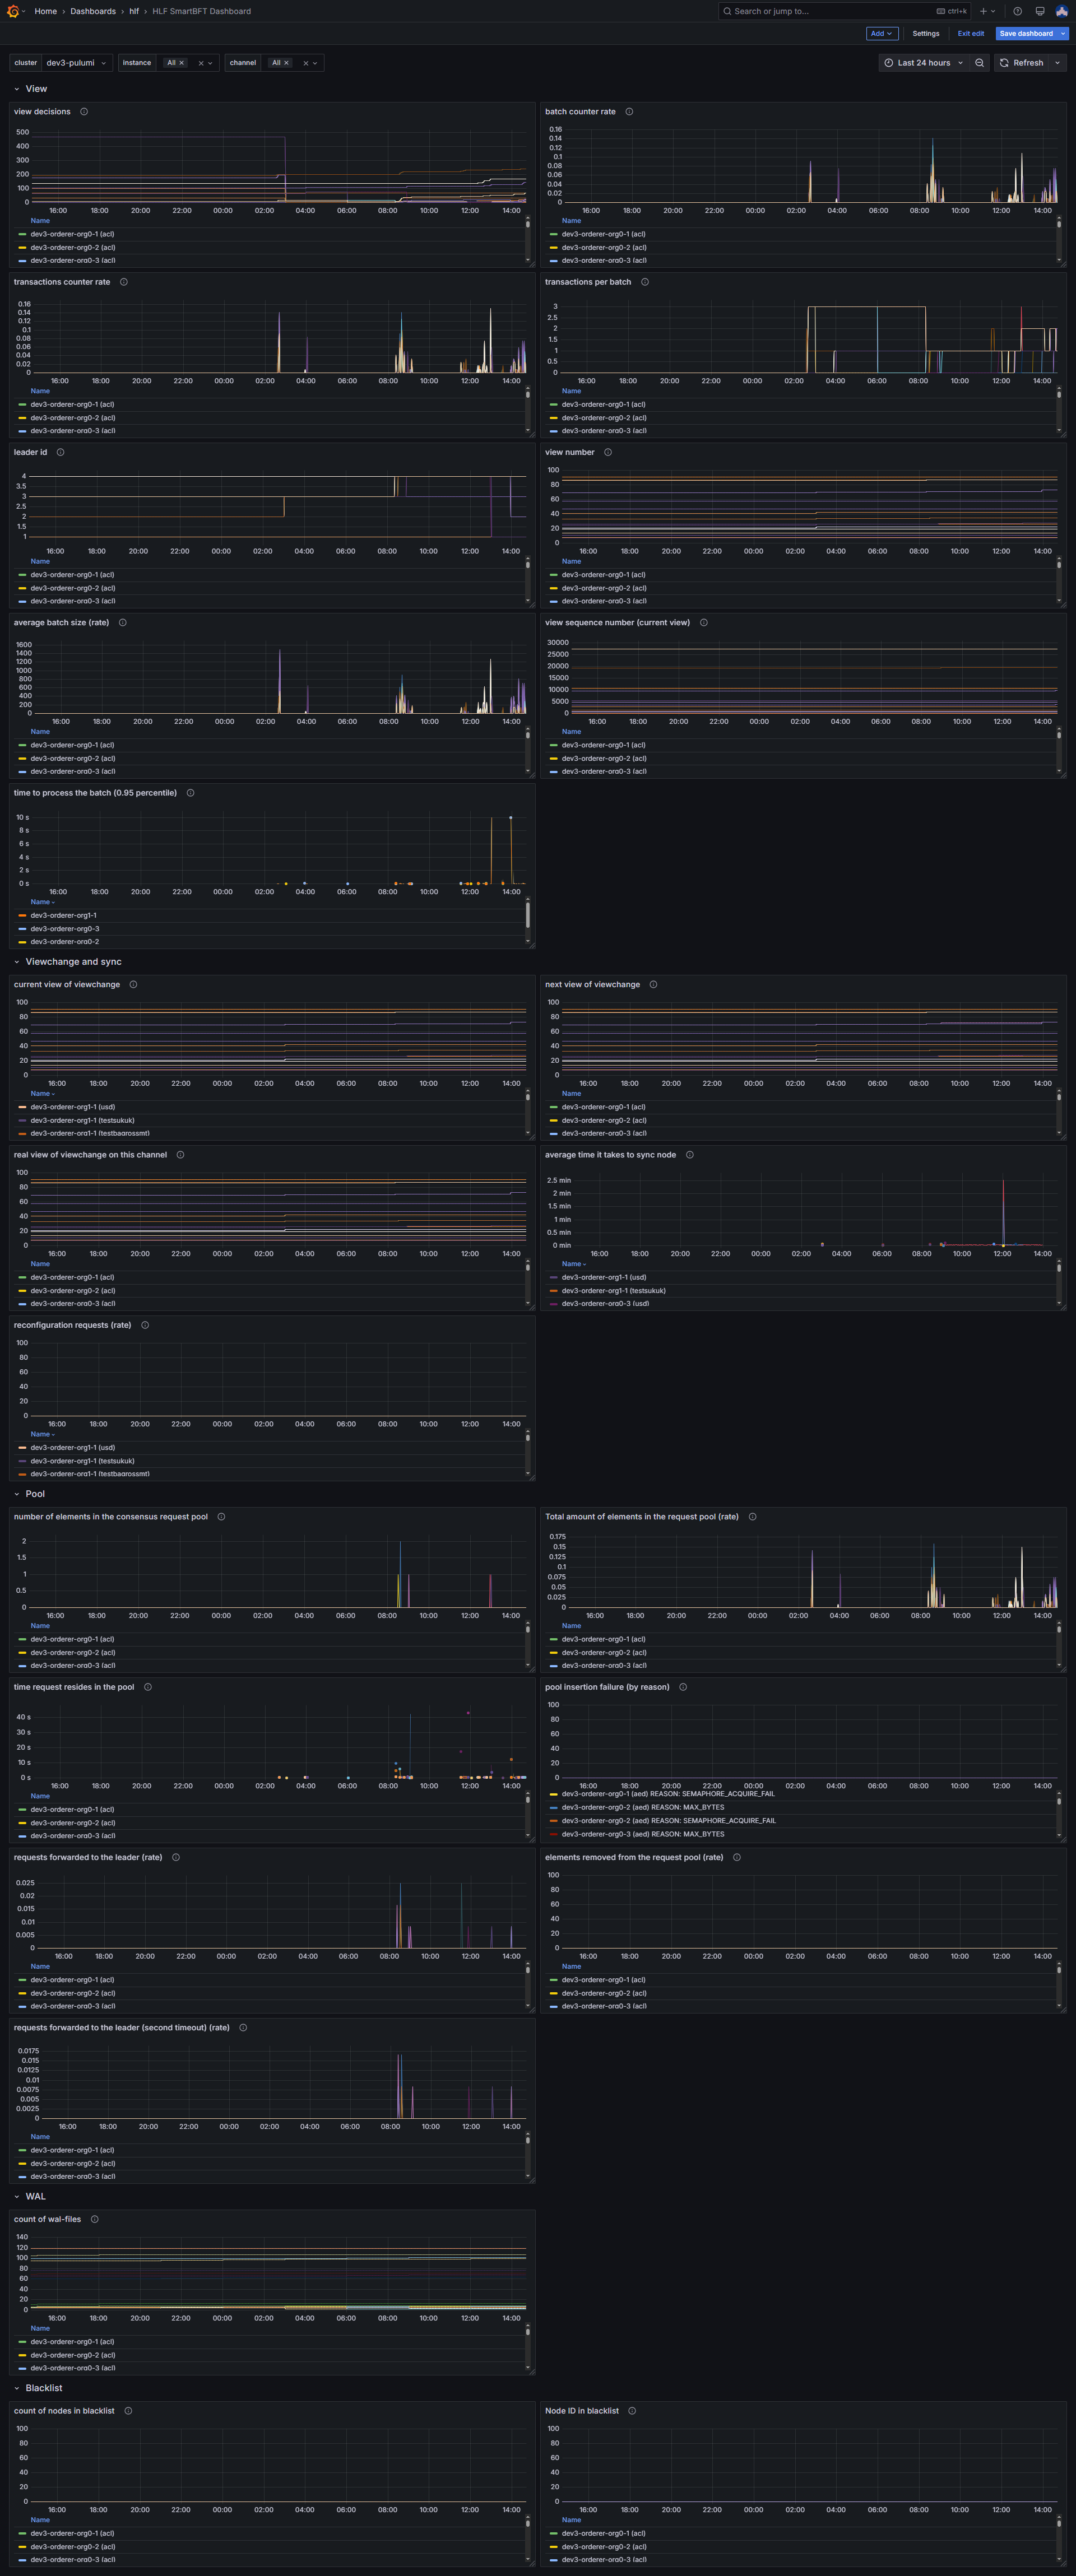
This dashboard provides detailed insights into SmartBFT consensus performance, transaction processing, and network health for Hyperledger Fabric deployments.
✨ Features
View Metrics
- View Decisions: Tracks consensus decisions made by SmartBFT
- Leader ID: Current consensus leader identification
- View Number: Current view in the consensus process
- Batch Processing: Transaction batching and processing rates
- Sequence Numbers: Proposal sequence tracking within views
Viewchange and Sync
- Current/Next/Real Views: View transition monitoring
- Sync Performance: Node synchronization metrics and timing
- Reconfiguration: Network reconfiguration request tracking
Pool Management
- Request Pool Size: Number of pending consensus requests
- Pool Latency: Time requests spend in the pool
- Forward Requests: Leader forwarding statistics
- Pool Failures: Failed request insertion tracking with reasons
- Timeout Handling: Second timeout request monitoring
System Health
- WAL Files: Write-Ahead Log file count monitoring
- Blacklist: Node blacklisting and exclusion tracking
📋 Requirements
Data Source
- Prometheus with SmartBFT metrics collection
Required Metrics
The dashboard expects these Prometheus metric families:
# View and consensus metrics
consensus_smartbft_view_decisions
consensus_smartbft_view_leader_id
consensus_smartbft_view_number
consensus_smartbft_view_count_batch_all
consensus_smartbft_view_count_txs_all
consensus_smartbft_view_count_txs_in_batch
consensus_smartbft_view_size_batch
consensus_smartbft_view_proposal_sequence
consensus_smartbft_view_latency_batch_processing_bucket
Viewchange metrics
consensus_smartbft_viewchange_current_view
consensus_smartbft_viewchange_next_view
consensus_smartbft_viewchange_real_view
consensus_smartbft_consensus_latency_sync_sum
consensus_smartbft_consensus_latency_sync_count
consensus_smartbft_consensus_reconfig
Pool metrics
consensus_smartbft_pool_count_of_elements
consensus_smartbft_pool_count_of_elements_all
consensus_smartbft_pool_latency_of_elements_sum
consensus_smartbft_pool_latency_of_elements_count
consensus_smartbft_pool_count_of_fail_add_request
consensus_smartbft_pool_count_leader_forward_request
consensus_smartbft_pool_count_of_delete_request
consensus_smartbft_pool_count_timeout_two_step
System metrics
consensus_smartbft_wal_count_of_files
consensus_smartbft_blacklist_count
consensus_smartbft_node_id_in_blacklist
Hyperledger Fabric Setup
- Fabric network with SmartBFT consensus enabled
- Prometheus metrics exporter configured
- Proper metric scraping intervals (recommended: 15-30s)
Data source config
Collector config:
Upload an updated version of an exported dashboard.json file from Grafana
| Revision | Description | Created | |
|---|---|---|---|
| Download |