OpenBSD SNMP
Dashboard for metrics from OpenBSD's snmpd(8), scraped with snmp_exporter. Maintained at https://got.stumpf.co/?action=summary&path=openbsd-grafana-dashboards.git along with the necessary generator.yml.
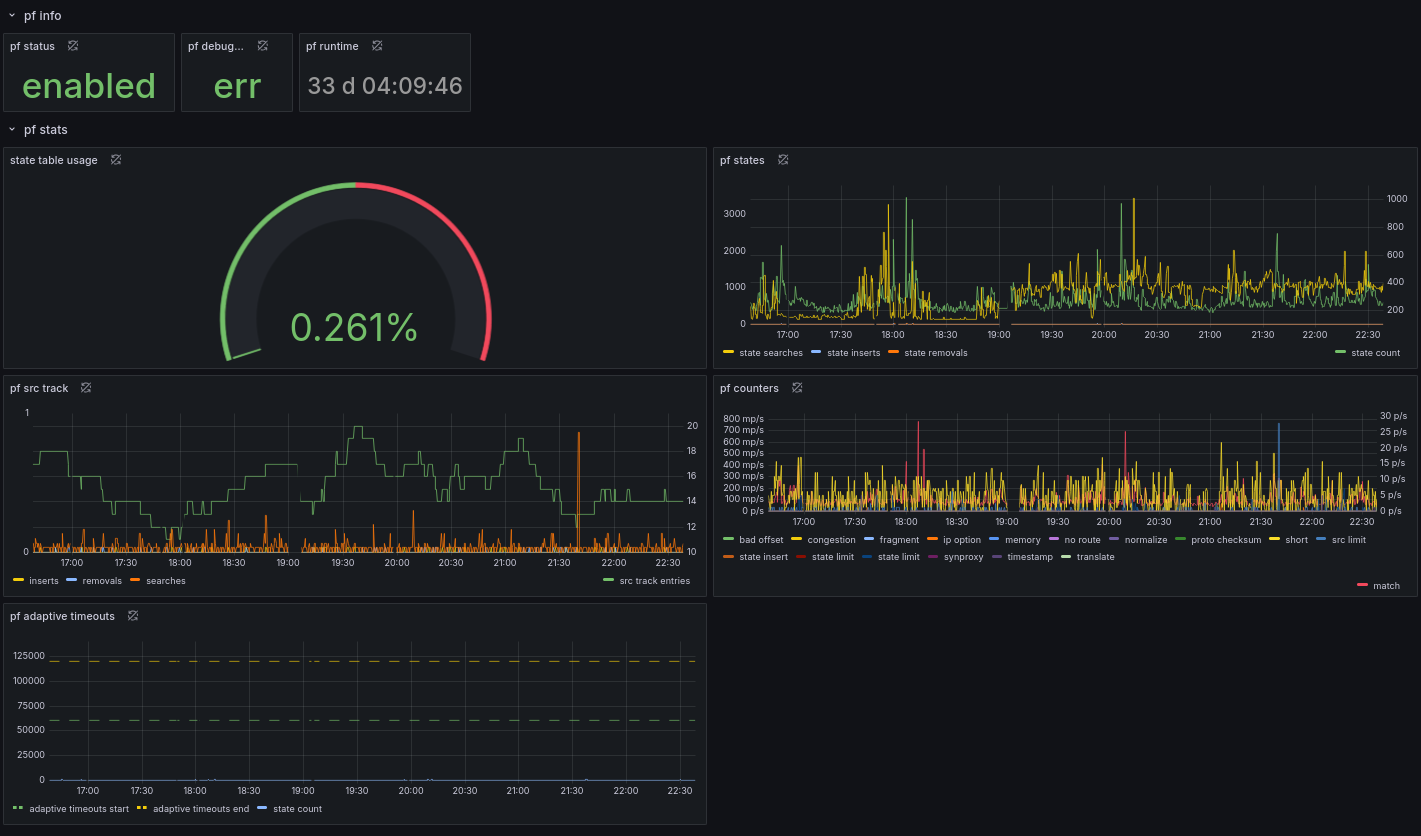
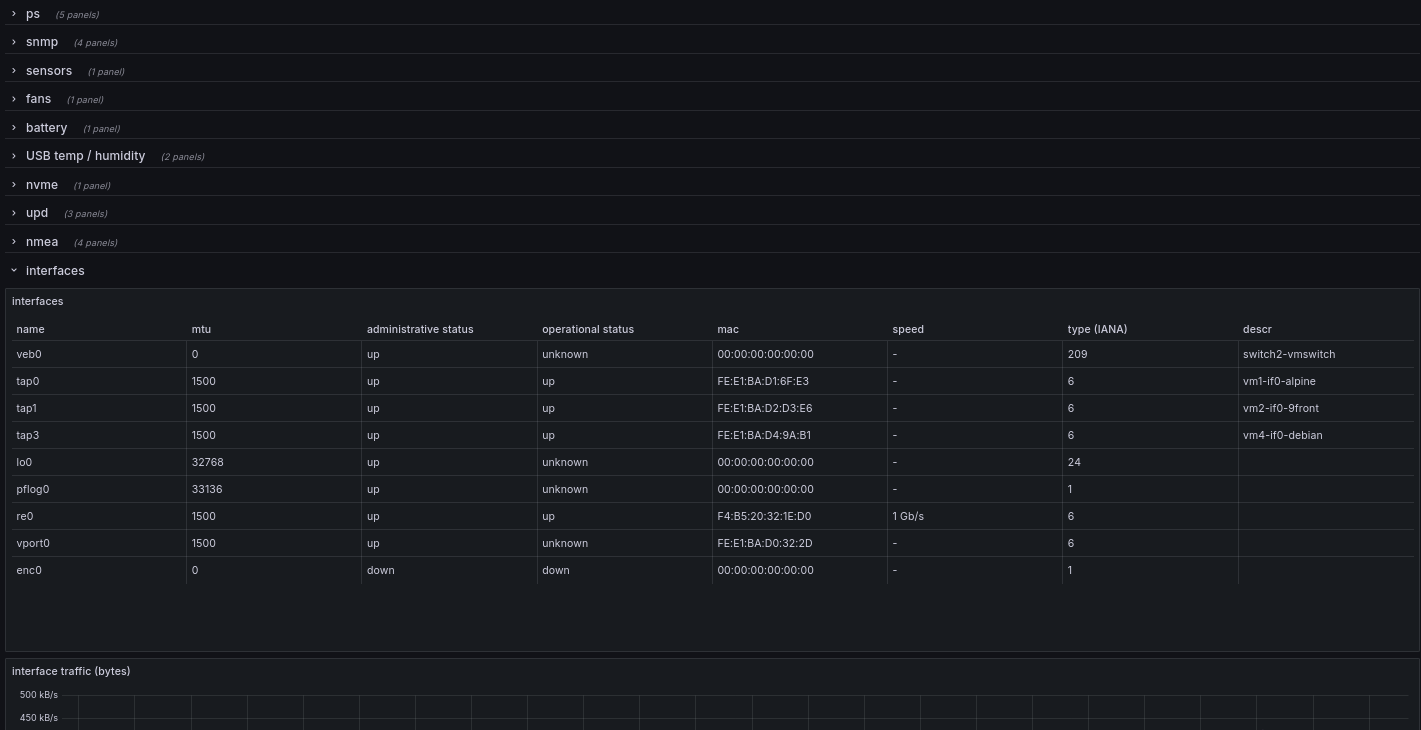
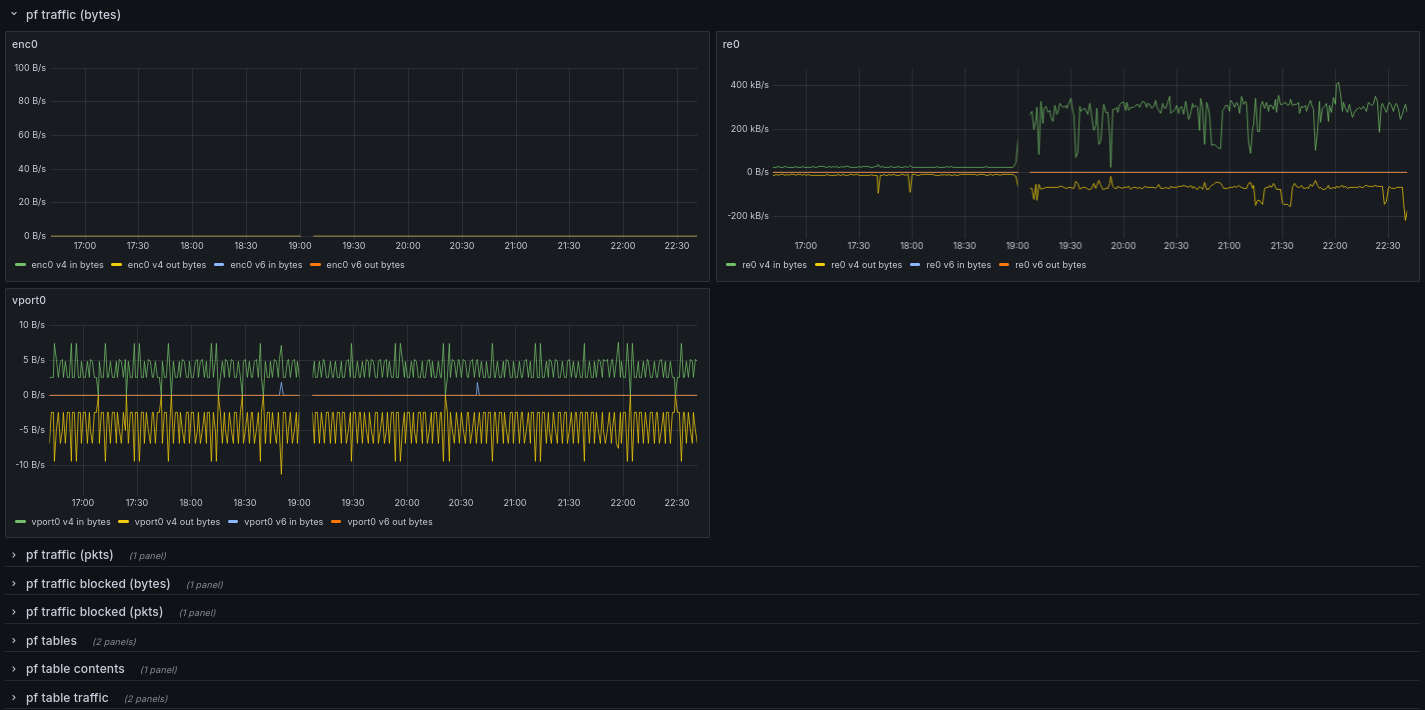
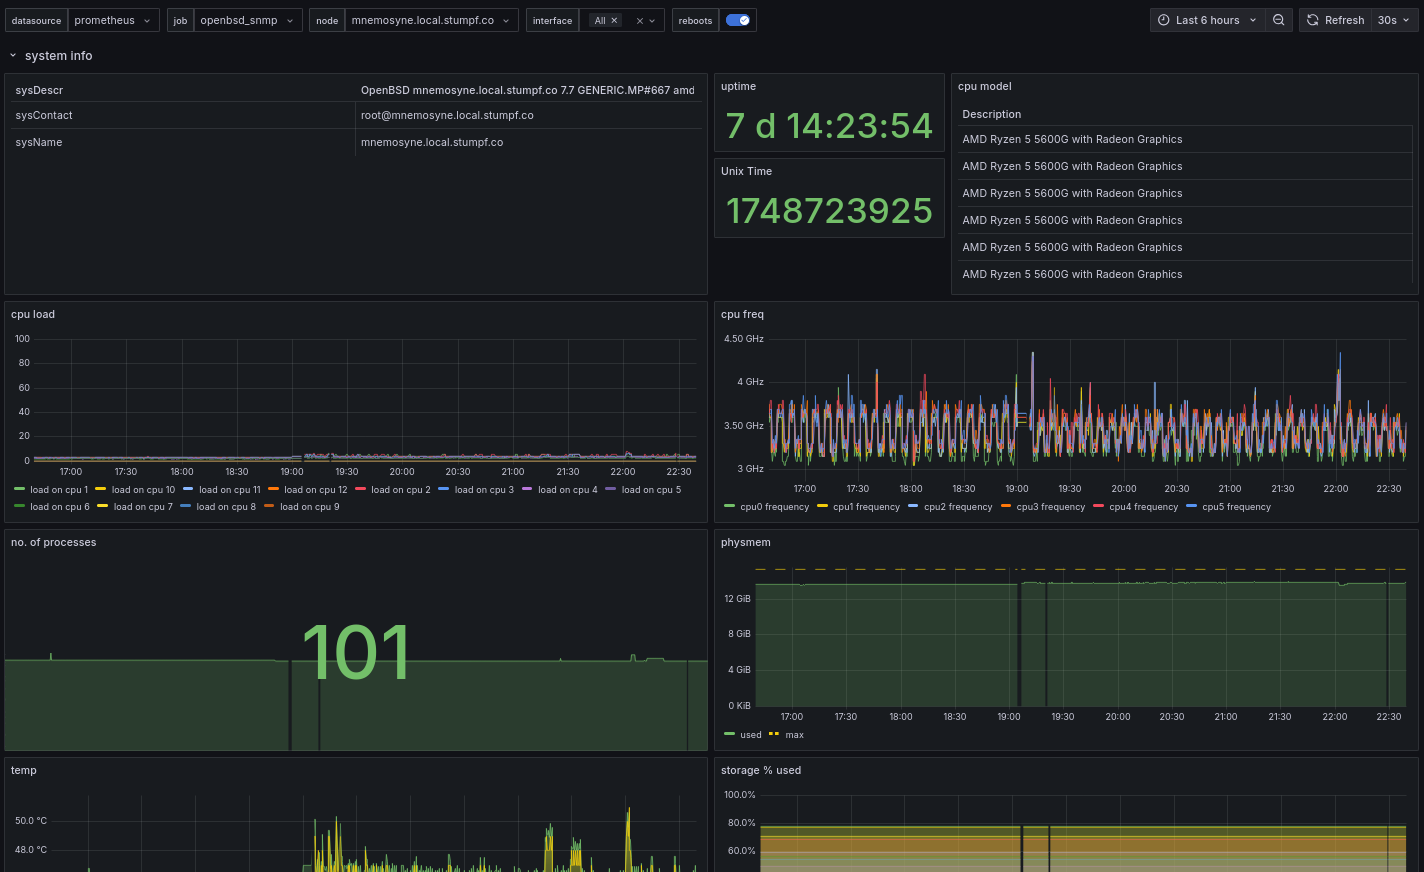
The OpenBSD SNMP dashboard uses the prometheus data source to create a Grafana dashboard with the gauge, geomap, stat, table and timeseries panels.
Data source config
Collector type:
Collector plugins:
Collector config:
Revisions
Upload an updated version of an exported dashboard.json file from Grafana
| Revision | Description | Created | |
|---|---|---|---|
| Download |
SNMP
Easily monitor any generic SNMP (Simple Network Management Protocol) device with Grafana Cloud's out-of-the-box monitoring solution.
Learn more