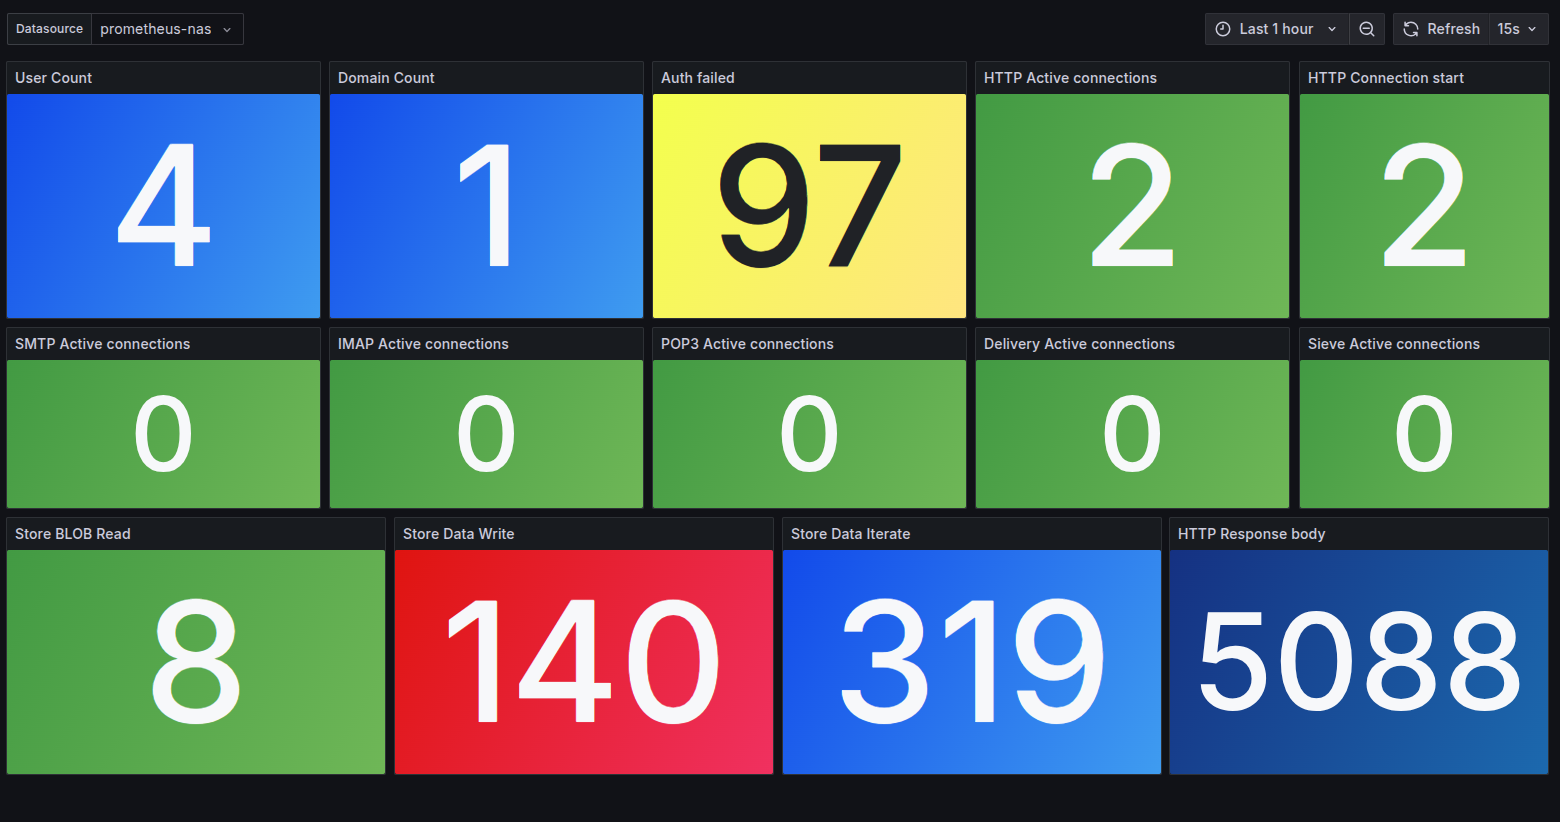
Stalwart Mailserver Metrics
Simple stalwart metrics dashboard based on the default stalwart metrics endpoint
Each metric is prefixed by "stalwart", the scraper should be configured as such:
  - job_name: 'stalwart'
    metrics_path: '/metrics/prometheus'
    metric_relabel_configs: # Add a 'stalwart' prefix to every metric
      - source_labels: [ __name__ ]
        separator: '_'
        regex: '(.*)'
        replacement: 'stalwart_$1'
        target_label: __name__
        action: replace
    static_configs:
      - targets: [ 'stalwart-mailserver:8080' ]
Data source config
Collector type:
Collector plugins:
Collector config:
Revisions
Upload an updated version of an exported dashboard.json file from Grafana
| Revision | Description | Created | |
|---|---|---|---|
| Download |