Golang Monitoring - Echo & GORM
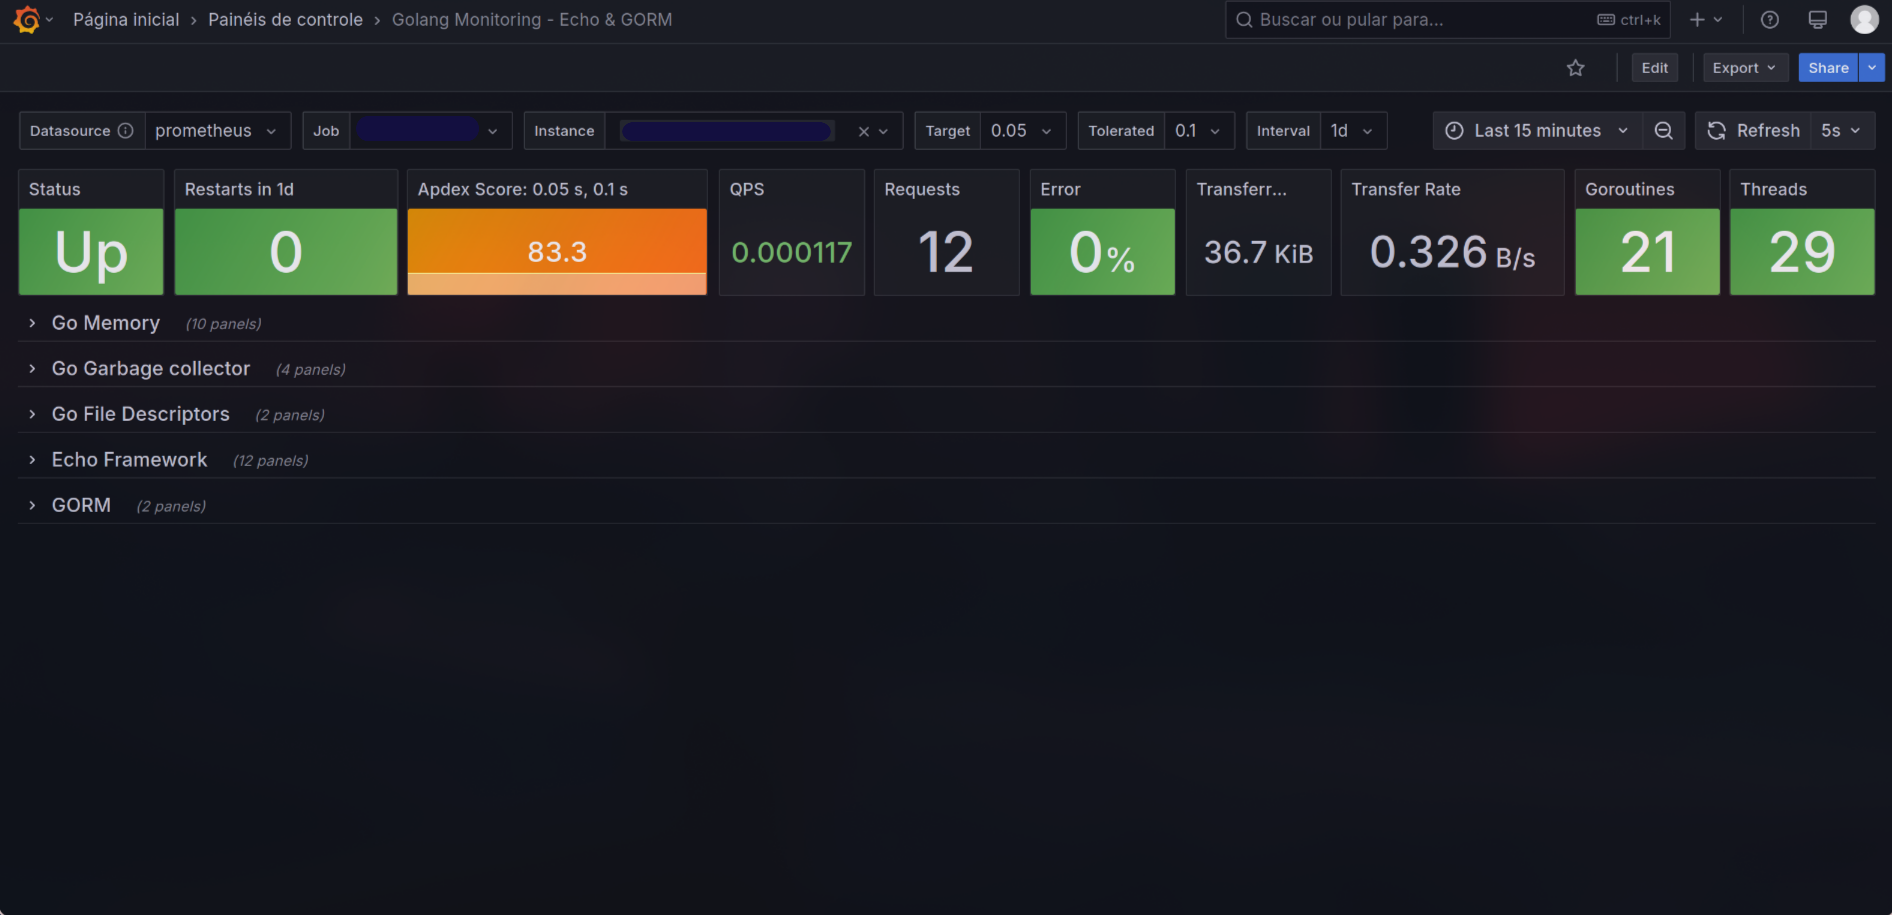
This production-ready dashboard provides full-stack visibility for Golang applications using Echo framework and GORM ORM. Monitor critical application metrics including HTTP performance, memory allocation patterns, garbage collection efficiency, and database connection pooling. Features intelligent Apdex scoring, live request tracing, and resource utilization trends with built-in alert thresholds. Perfect for DevOps teams managing high-performance Golang microservices.
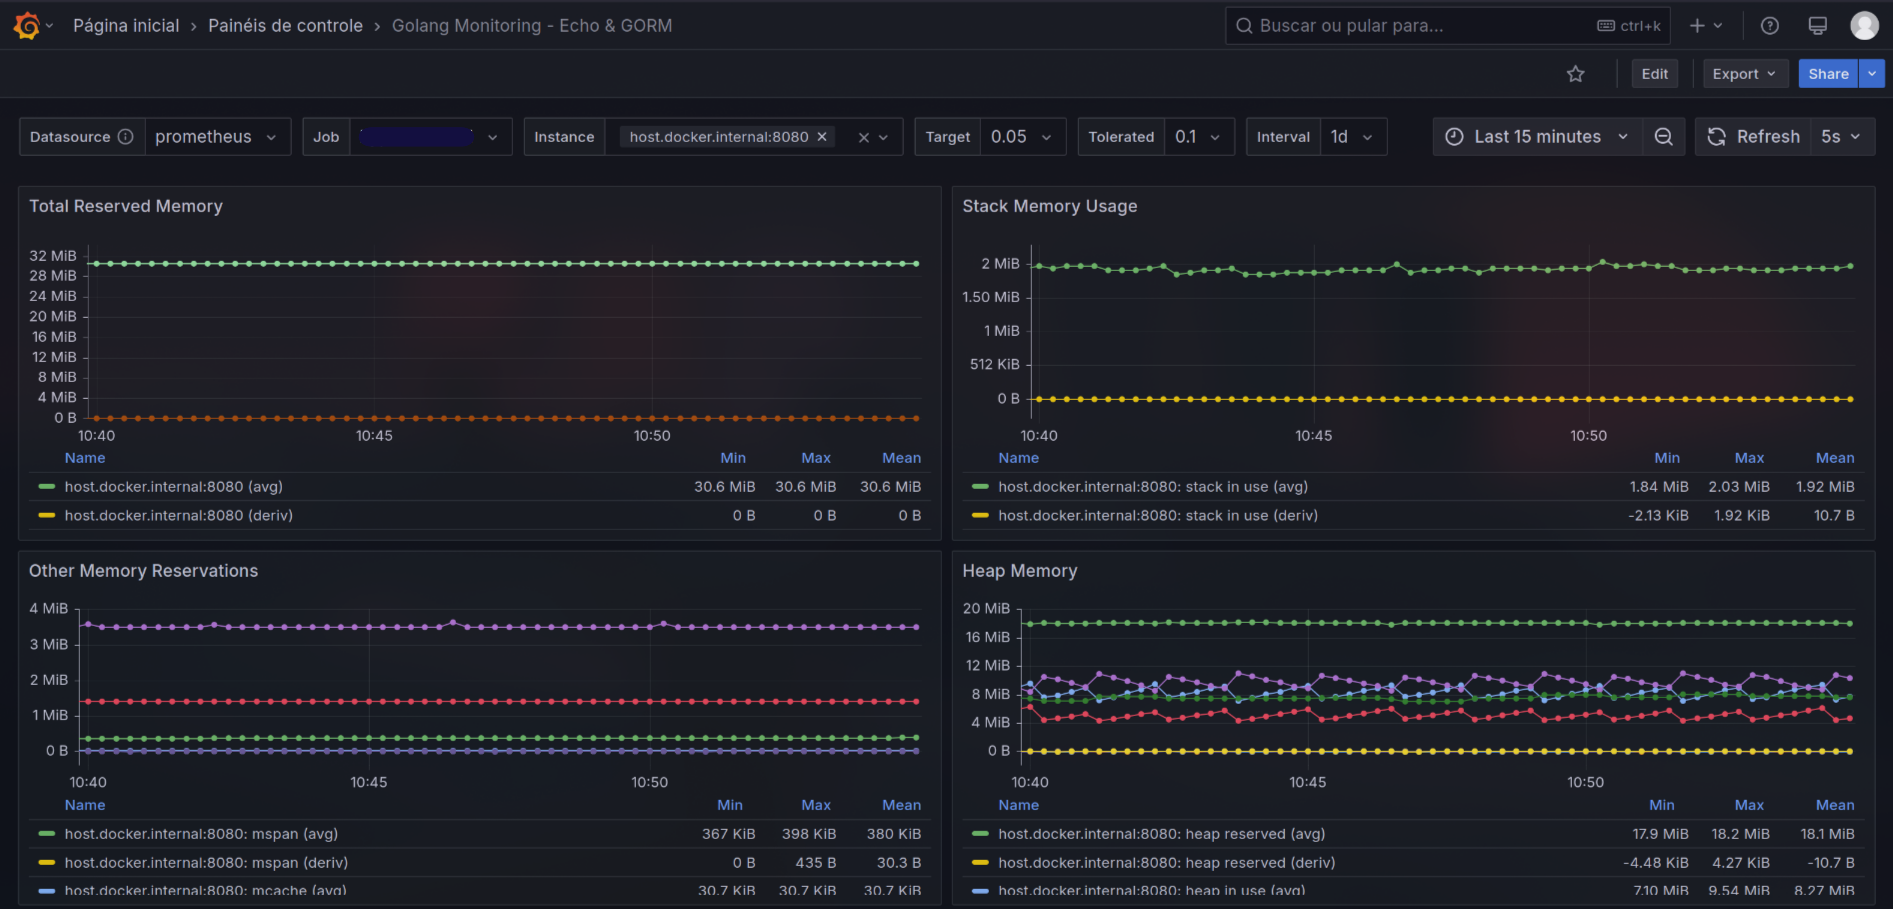
Golang Echo & GORM Monitoring Dashboard
Overview
A comprehensive monitoring solution for Golang applications using the Echo web framework and GORM ORM. This dashboard provides deep insights into application performance, resource utilization, and database operations through Prometheus metrics integration.
Key Features:
- Real-time monitoring of Golang runtime metrics
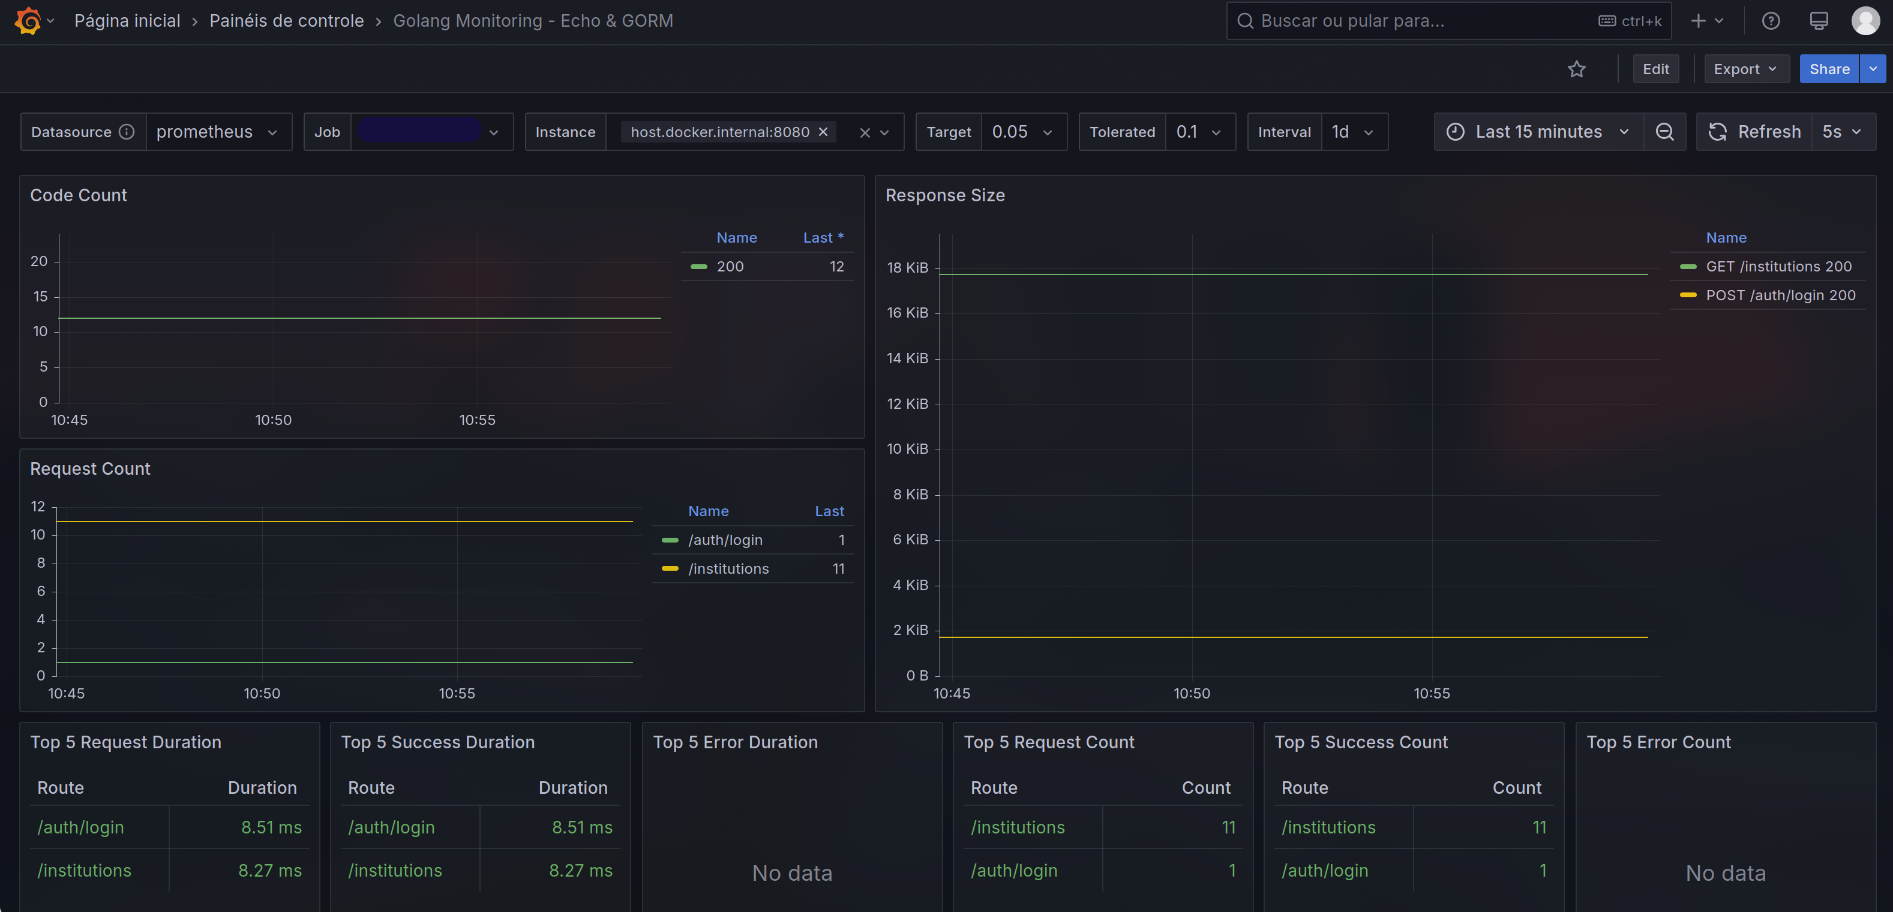
- Echo framework performance analytics
- GORM database connection tracking
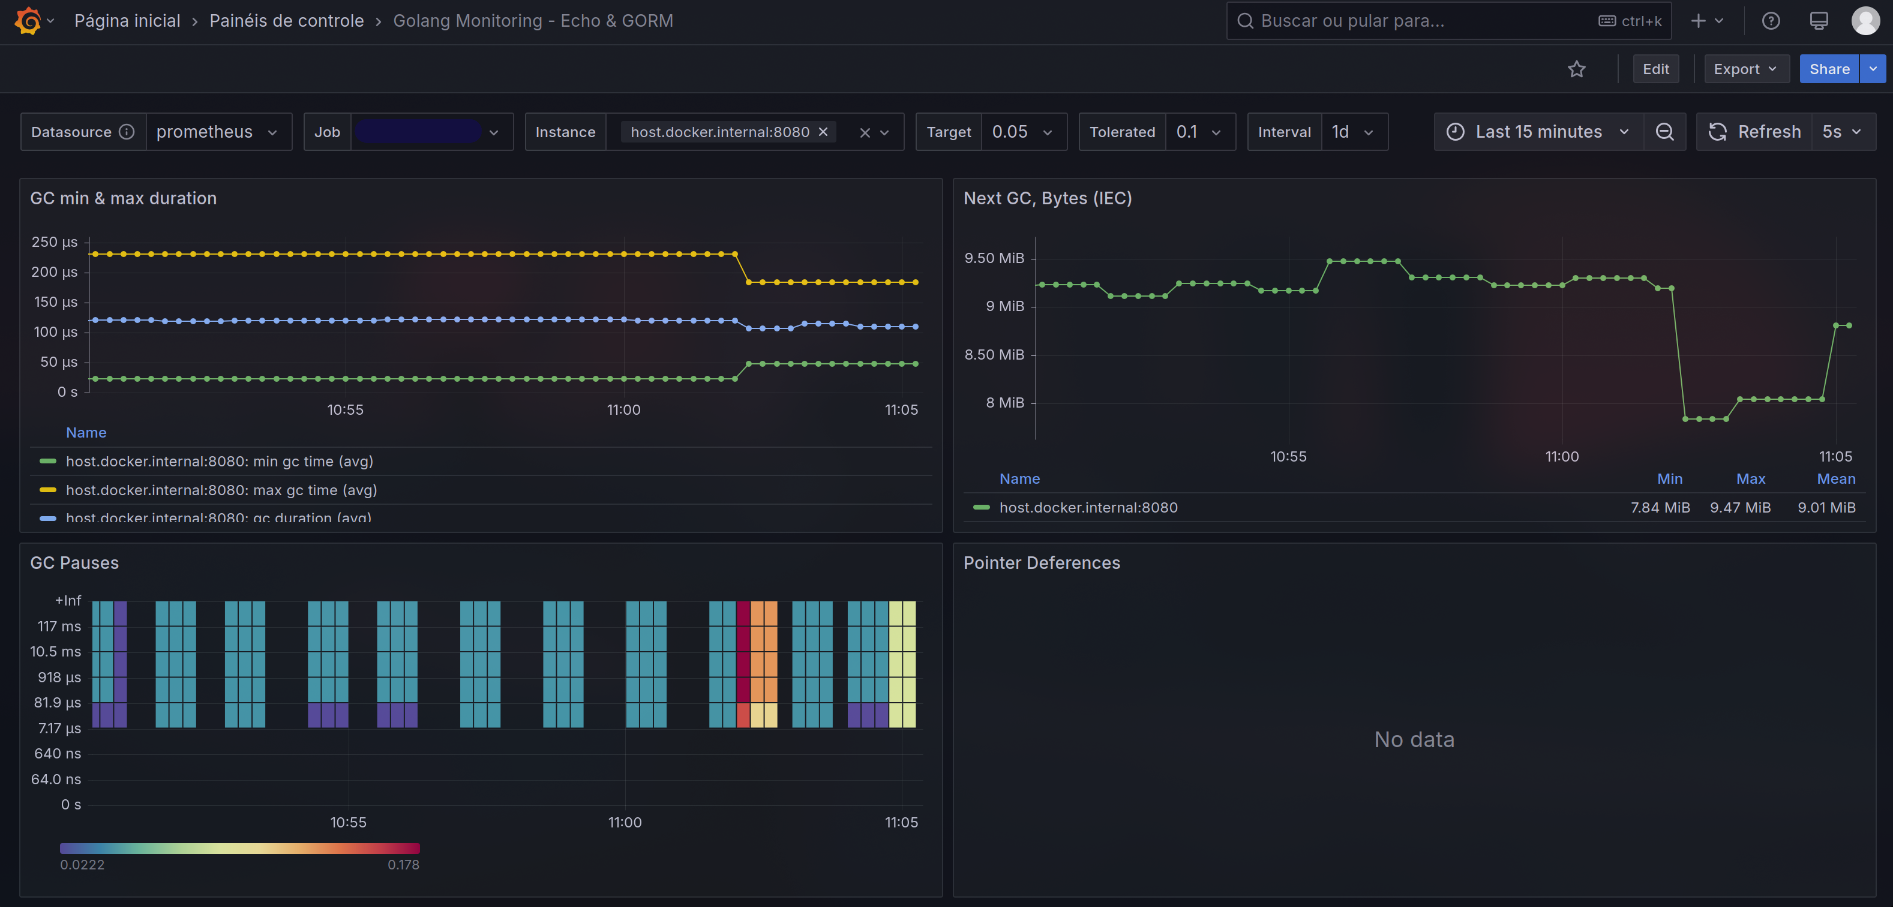
- Memory and garbage collection insights
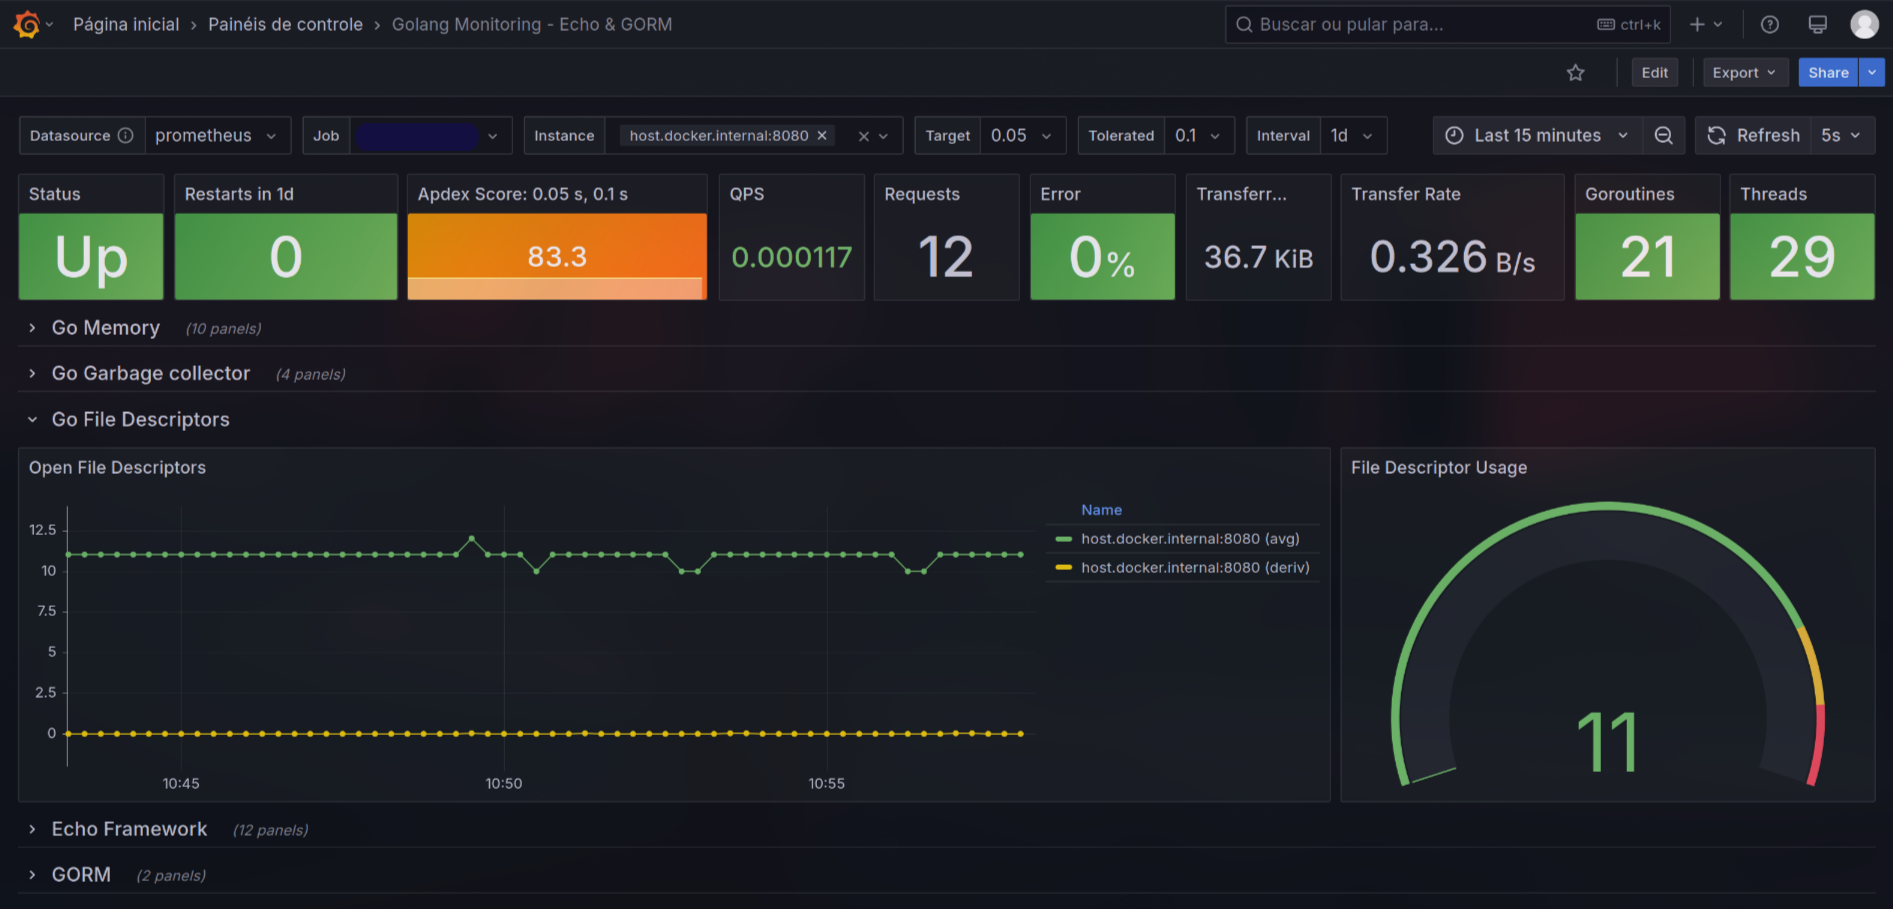
- File descriptor usage tracking
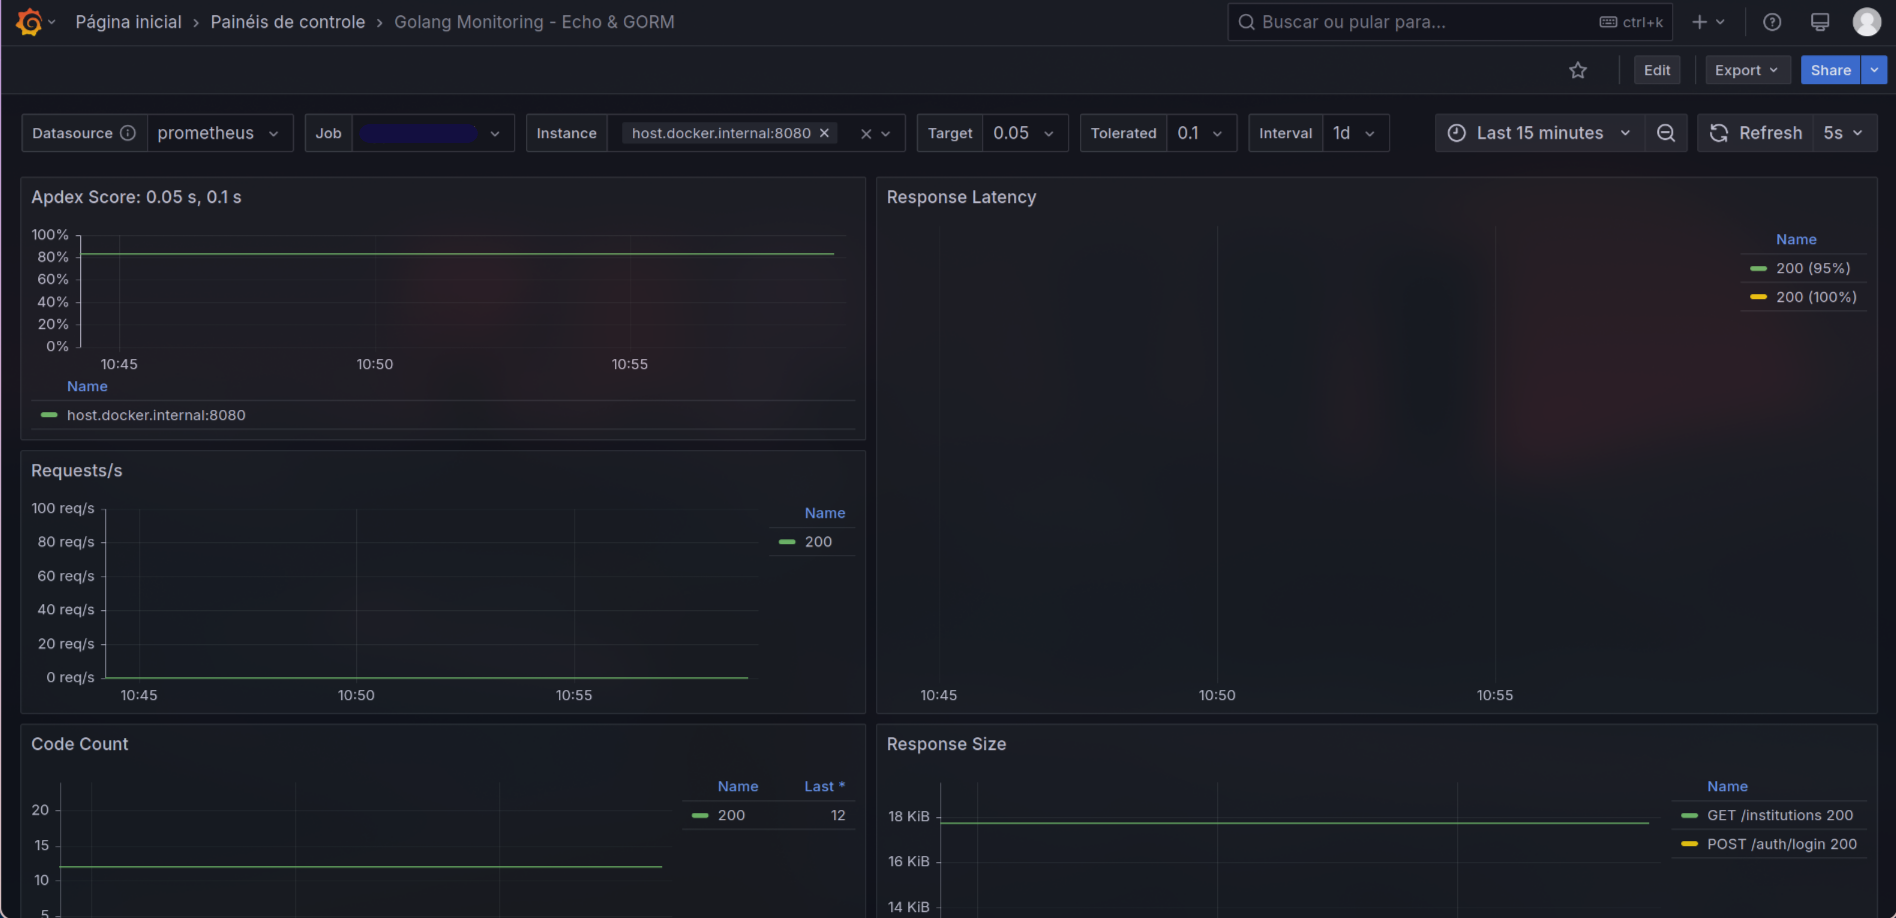
- HTTP request analytics with Apdex scoring
- Pre-configured alerts through visual thresholds
Metrics Monitored
Application Health
- Service status (Up/Down)
- Process restarts
- Goroutine/thread counts
- File descriptor usage vs limits
Performance Metrics
- Request latency (95th/99th percentiles)
- QPS (Queries Per Second)
- Error rates (4xx/5xx responses)
- Apdex score calculation
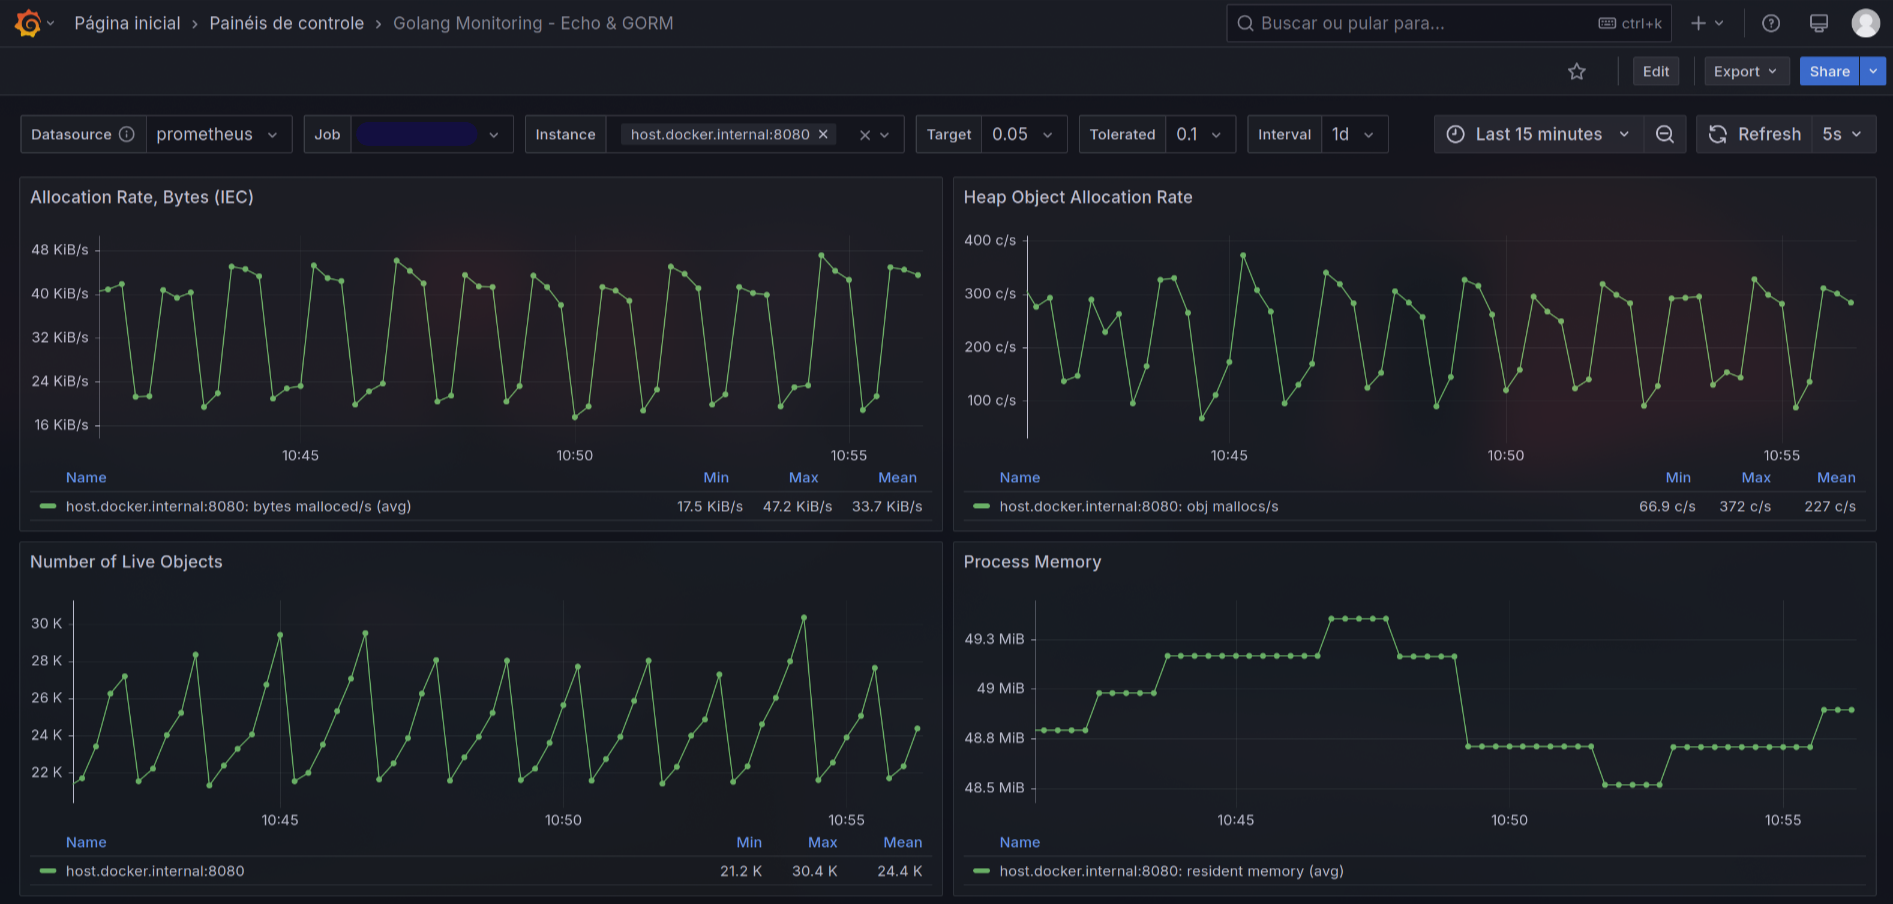
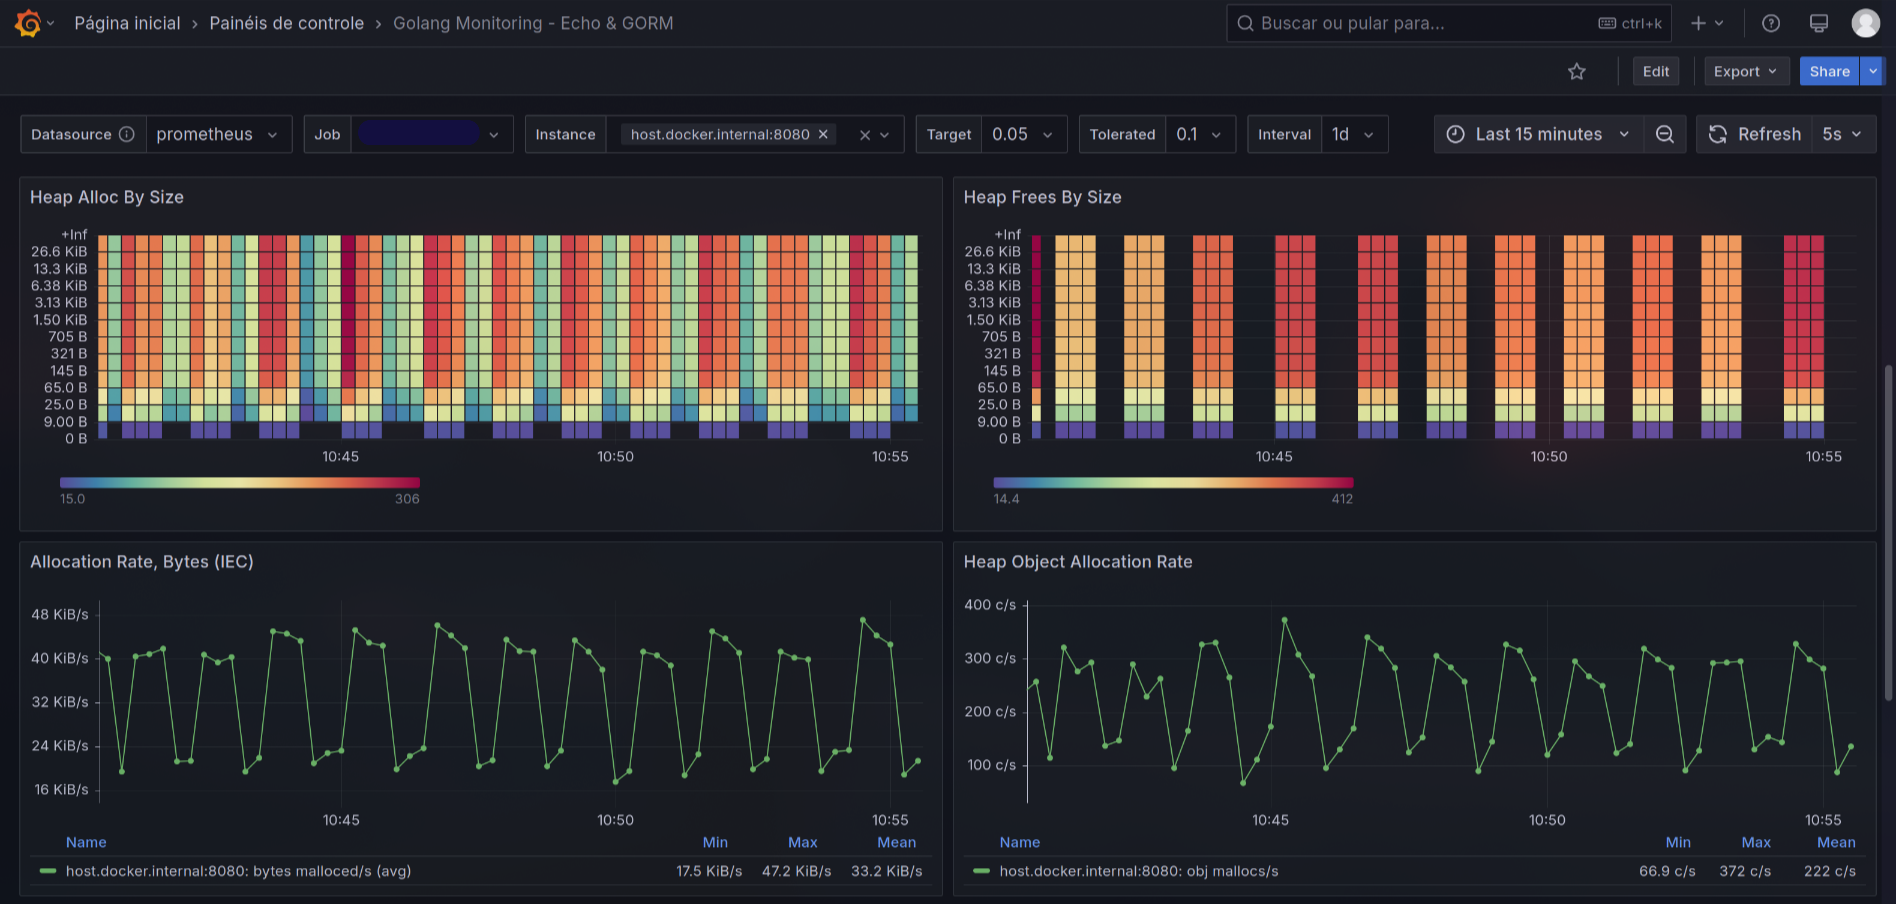
- Memory allocation patterns
- GC pause durations
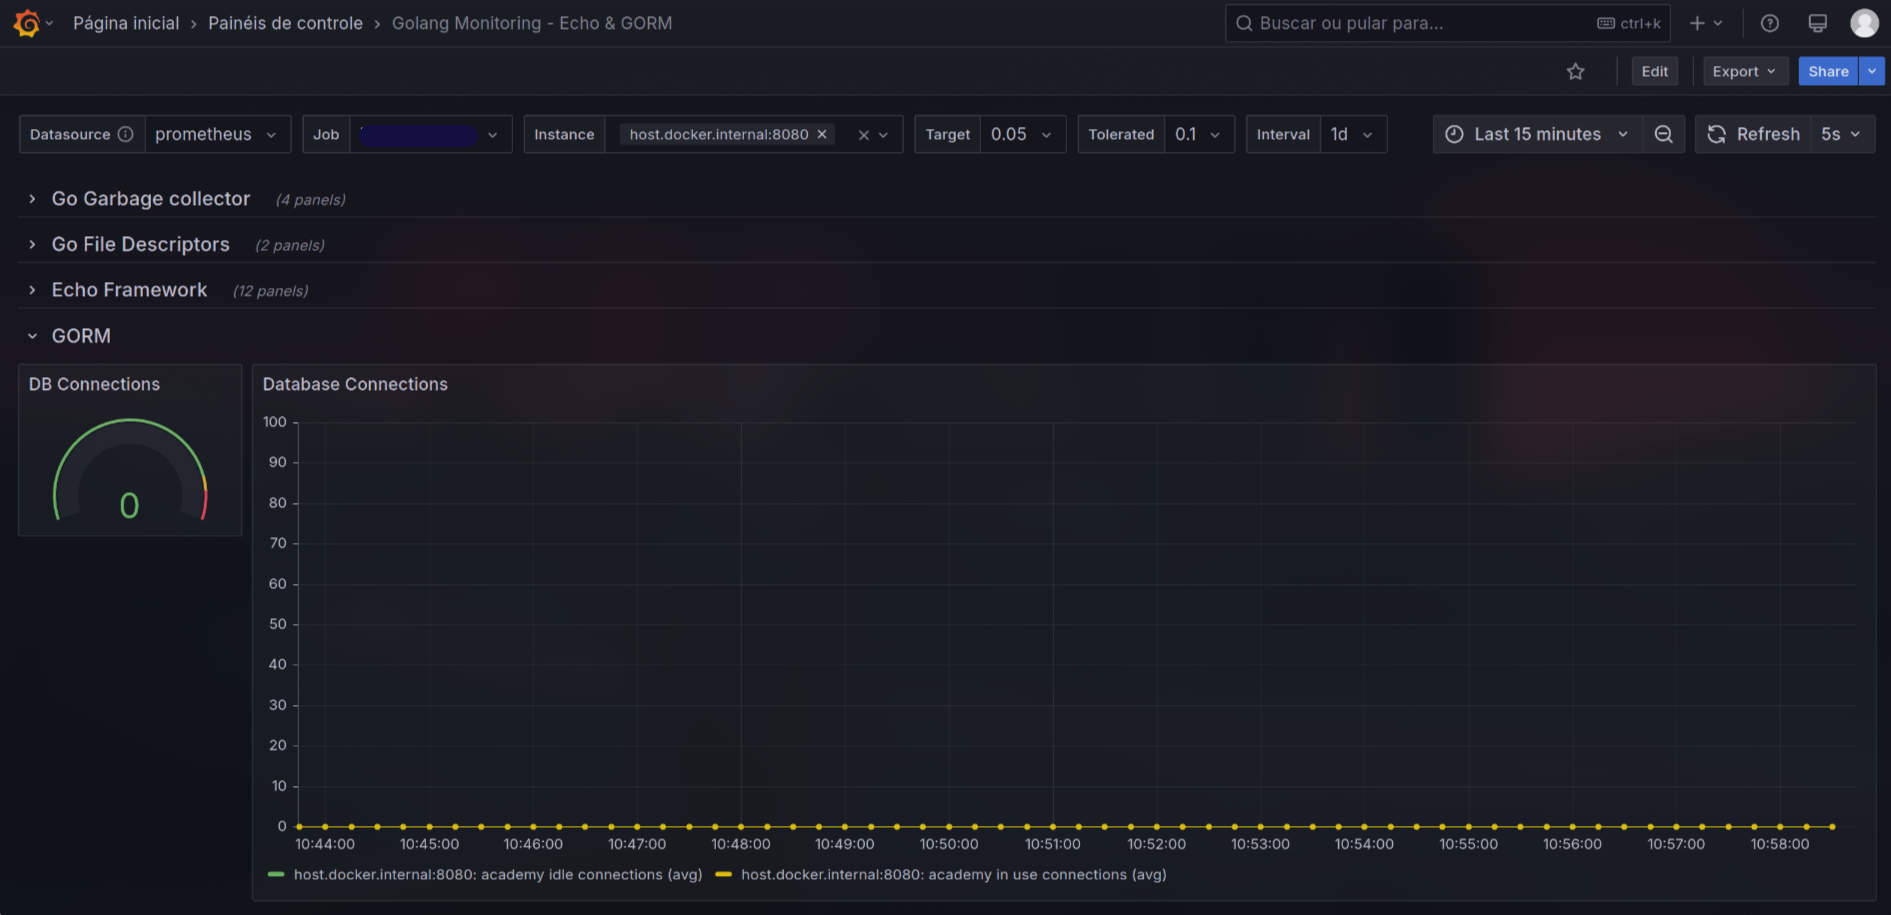
Database Monitoring
- Connection pool utilization
- Active vs idle connections
- Connection wait times
- SQL query rates
Resource Utilization
- Memory breakdown (heap, stack, GC)
- CPU usage metrics
- Network I/O statistics
- Goroutine lifecycle tracking
Installation
- Prerequisites:
- Prometheus instance scraping your Golang application
- Grafana v11.6.1+ with Prometheus datasource configured
- Import Dashboard:
- Download the JSON file
- In Grafana: Create → Import → Upload JSON
- Configure datasource mapping
- Configure Variables:
- $instance: Your application instances
- $job: Prometheus job label
- $target/$tolerated: Apdex thresholds
- $interval: Time range selector
Usage Tips
- Use the Time Range selector for historical analysis
- Hover over gauge widgets for threshold percentages
- Click panel titles to inspect raw metrics
- Adjust Apdex thresholds via template variables
- Utilize row collapsing for focused analysis
- Combine with Prometheus alerts for proactive monitoring
Customization
- Modify thresholds in gauge panels
- Add/remove metrics in table panels
- Adjust color schemes in field overrides
- Create annotations for deployment events
- Add custom metrics through Prometheus queries
Data source config
Collector config:
Upload an updated version of an exported dashboard.json file from Grafana
| Revision | Description | Created | |
|---|---|---|---|
| Download |
Go
Easily monitor Go, the programming language designed at Google to make programmers more productive in applications with strong networking concurrency needs, with Grafana Cloud's out-of-the-box monitoring solution.
Learn more