ZTE Router
Monitoring for ZTE F670L
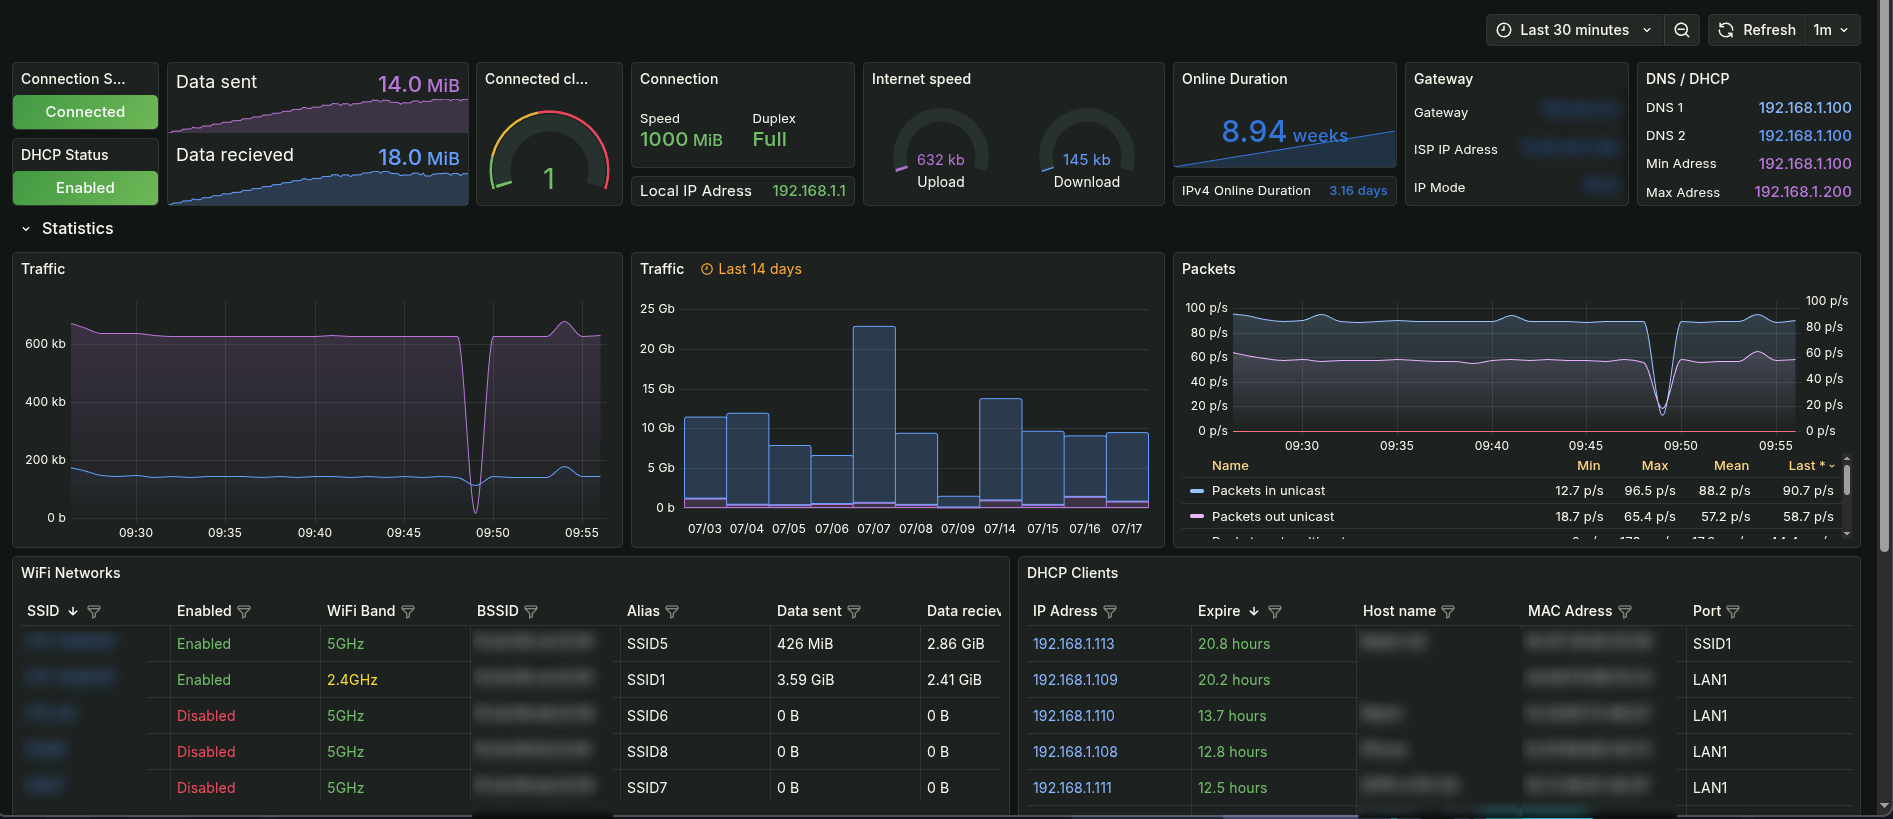
The ZTE Router dashboard uses the prometheus data source to create a Grafana dashboard with the barchart, gauge, stat, table and timeseries panels.
Data source config
Collector type:
Collector plugins:
Collector config:
Revisions
Upload an updated version of an exported dashboard.json file from Grafana
| Revision | Description | Created | |
|---|---|---|---|
| Download |