Kaiten-Overview
Track Kaiten's page load, card operations, event processing, and database performance.
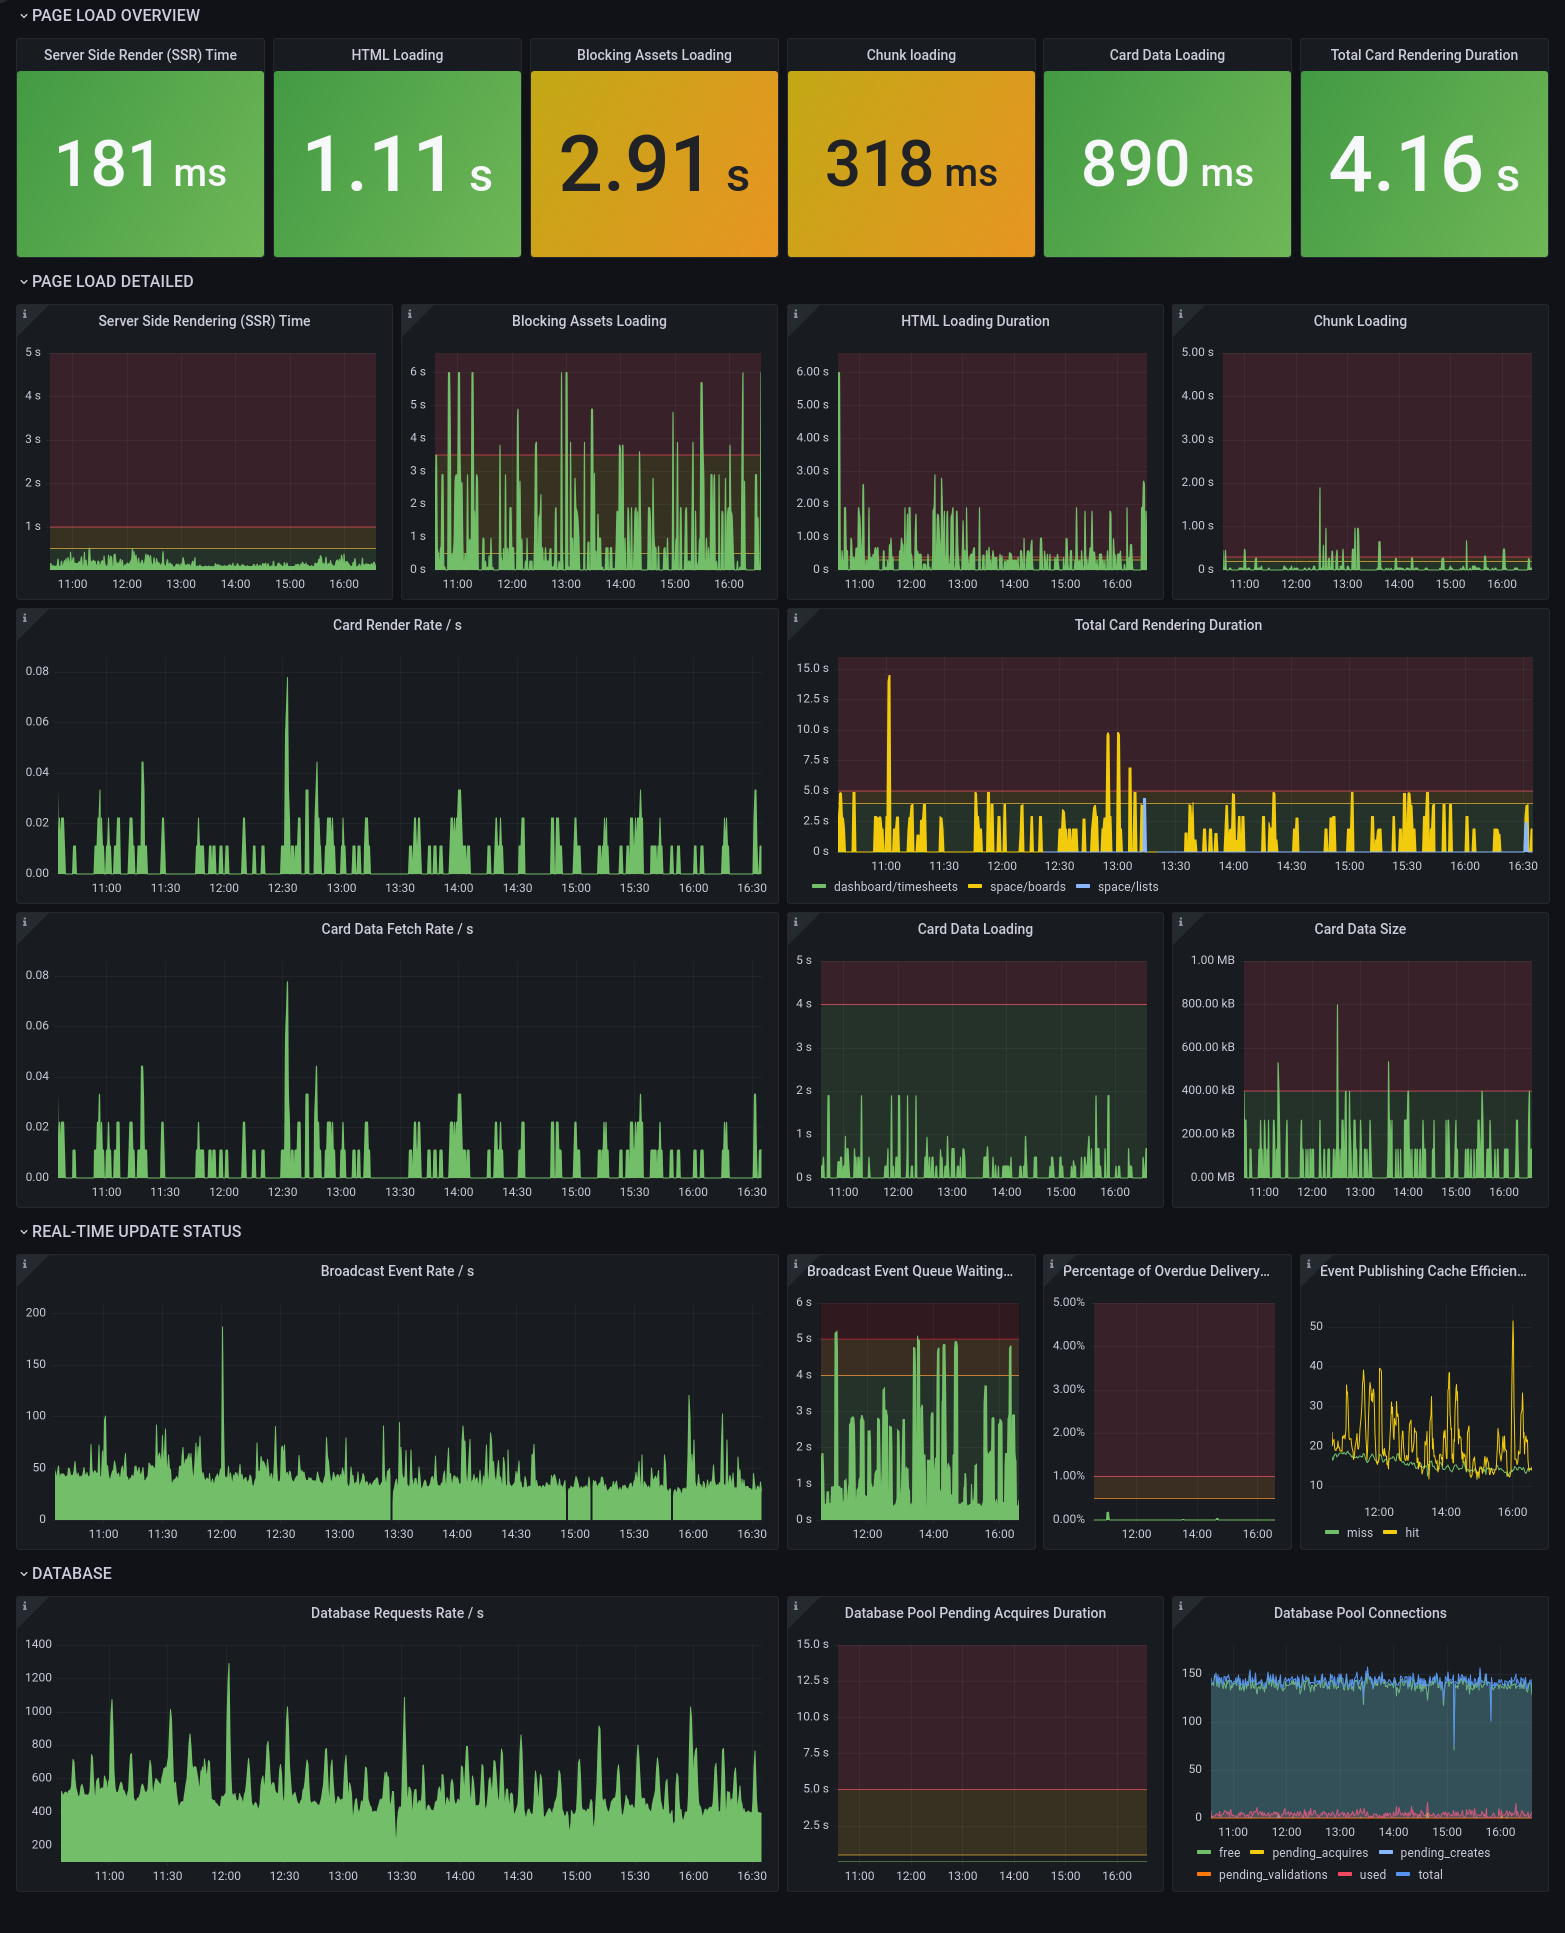
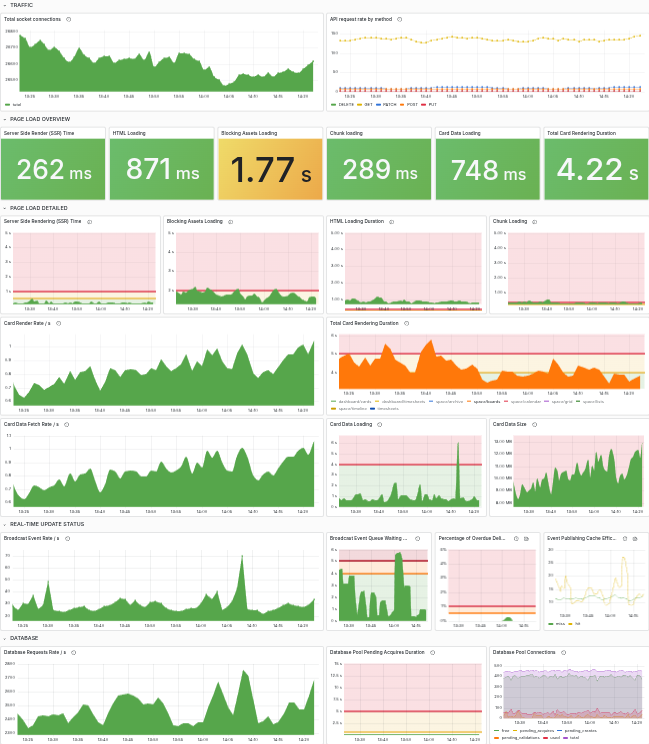
Kaiten-Overview is a dashboard for monitoring key performance metrics of the web application kaiten.ru. The dashboard provides a high-level overview of the following areas:
Page Loading Metrics for server-side rendering, HTML delivery, blocking assets, and chunk loading.
Card Operations Metrics for card render frequency, total card rendering time, card data fetch rate, card data loading time, and card data size.
Event Processing Metrics for broadcast event rate, event queue waiting time, percentage of overdue events, and cache efficiency during event publishing.
Database Metrics for database request rate, connection pool waiting time, and connection pool usage.
Use this dashboard to quickly assess the health and performance of critical Kaiten components.
Data source config
Collector config:
Upload an updated version of an exported dashboard.json file from Grafana
| Revision | Description | Created | |
|---|---|---|---|
| Download |