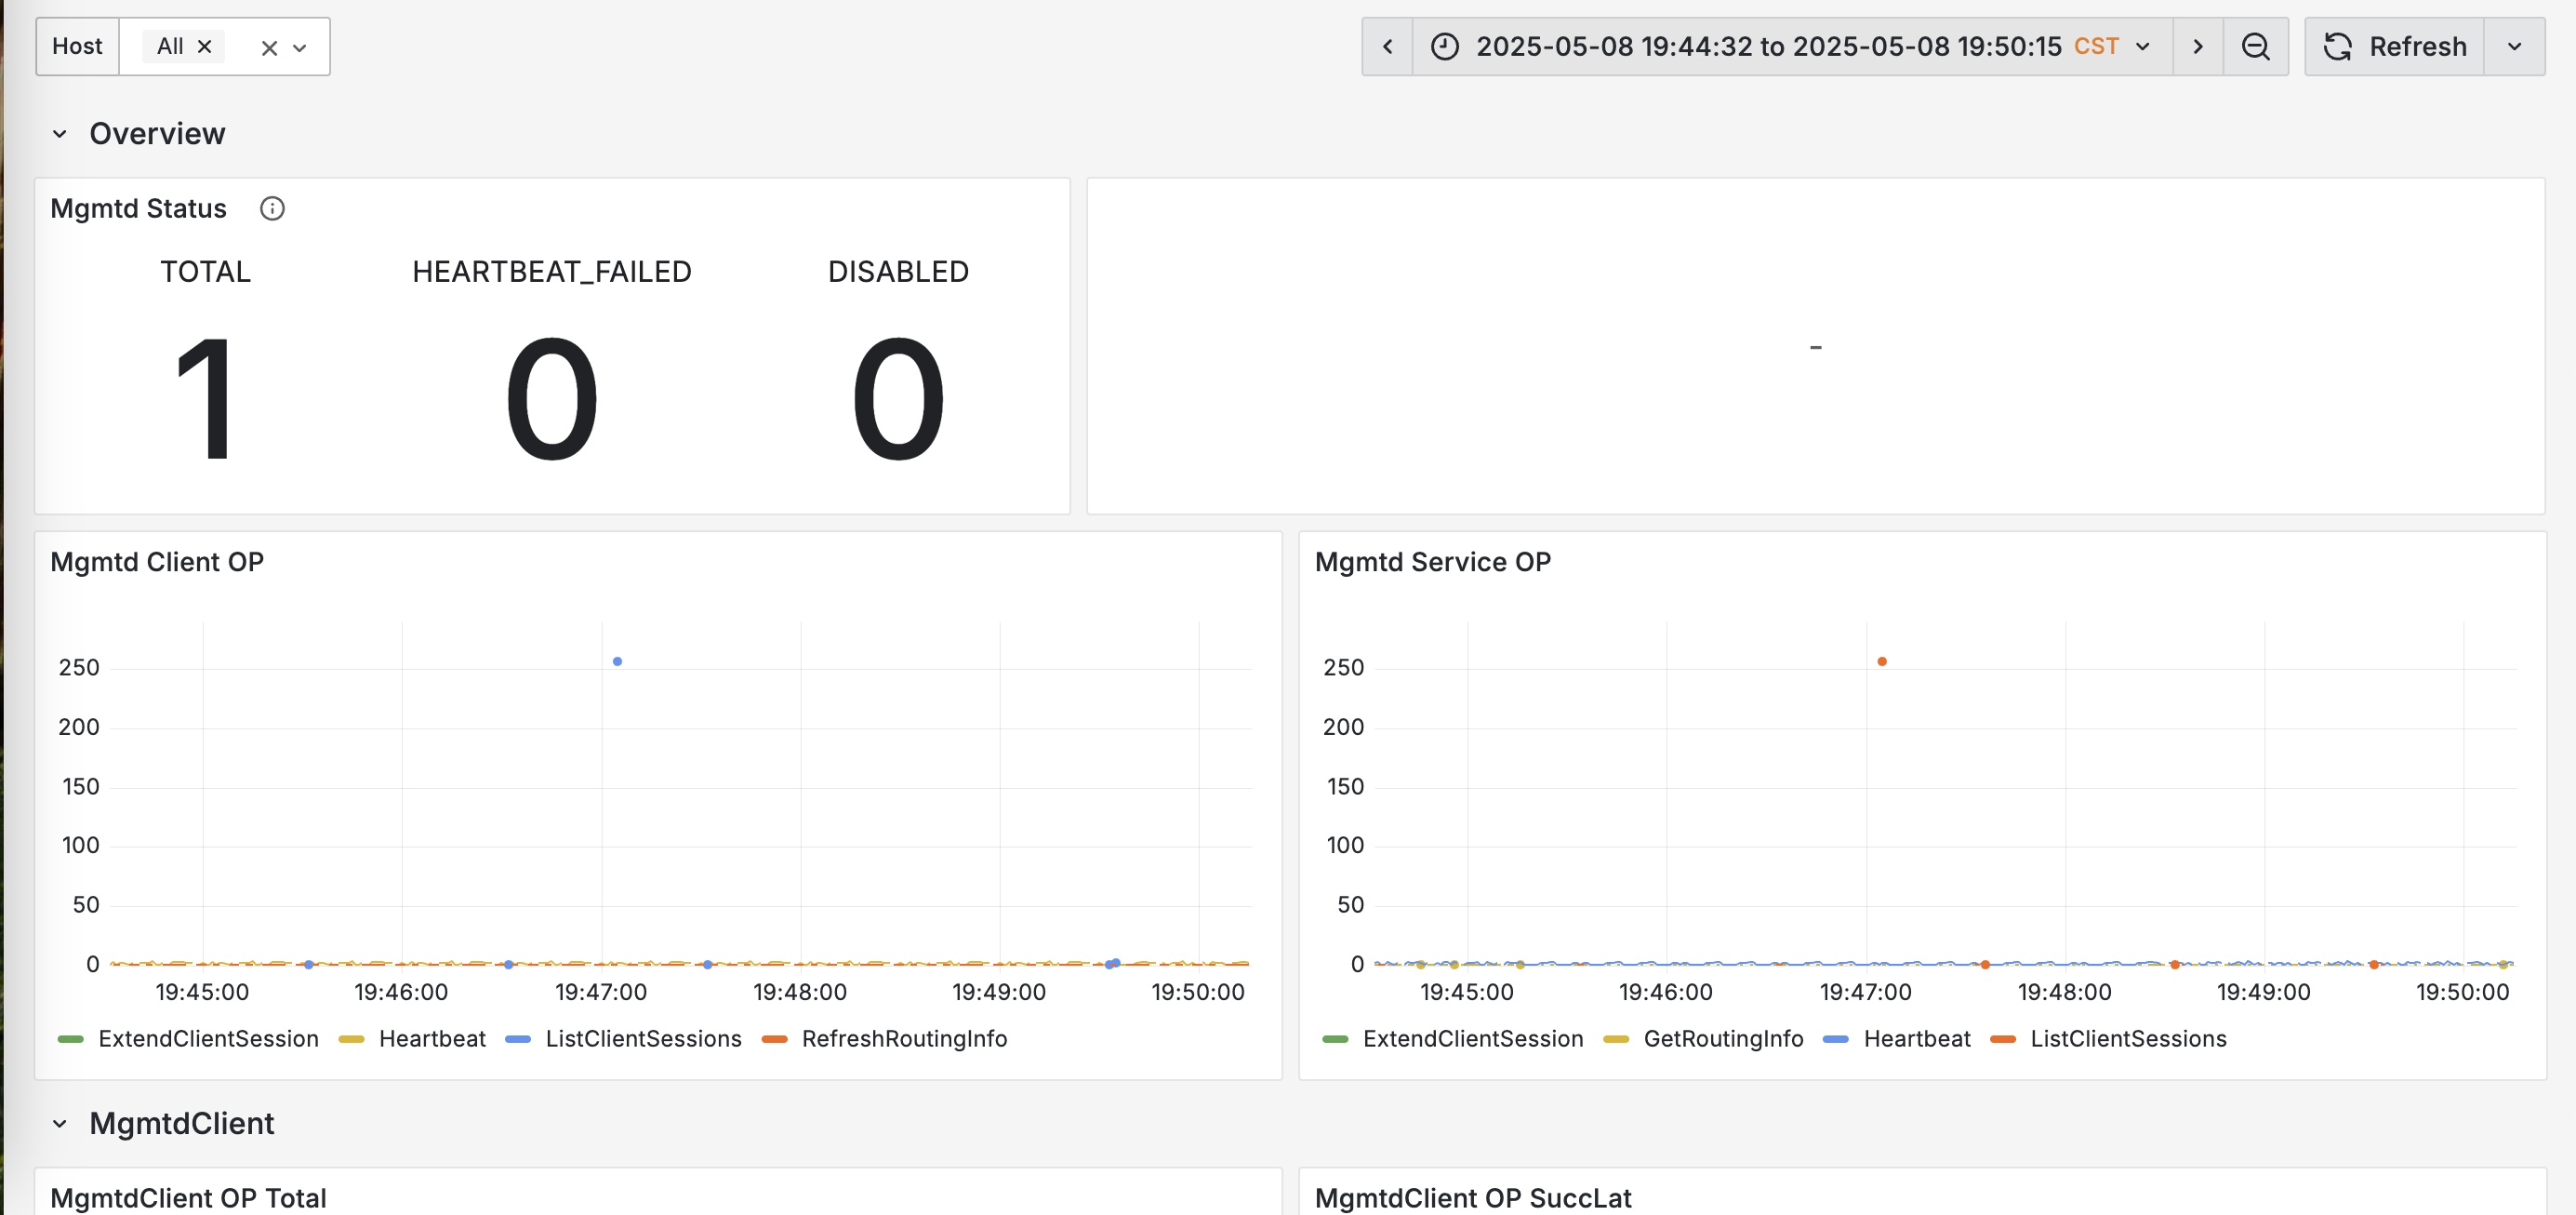
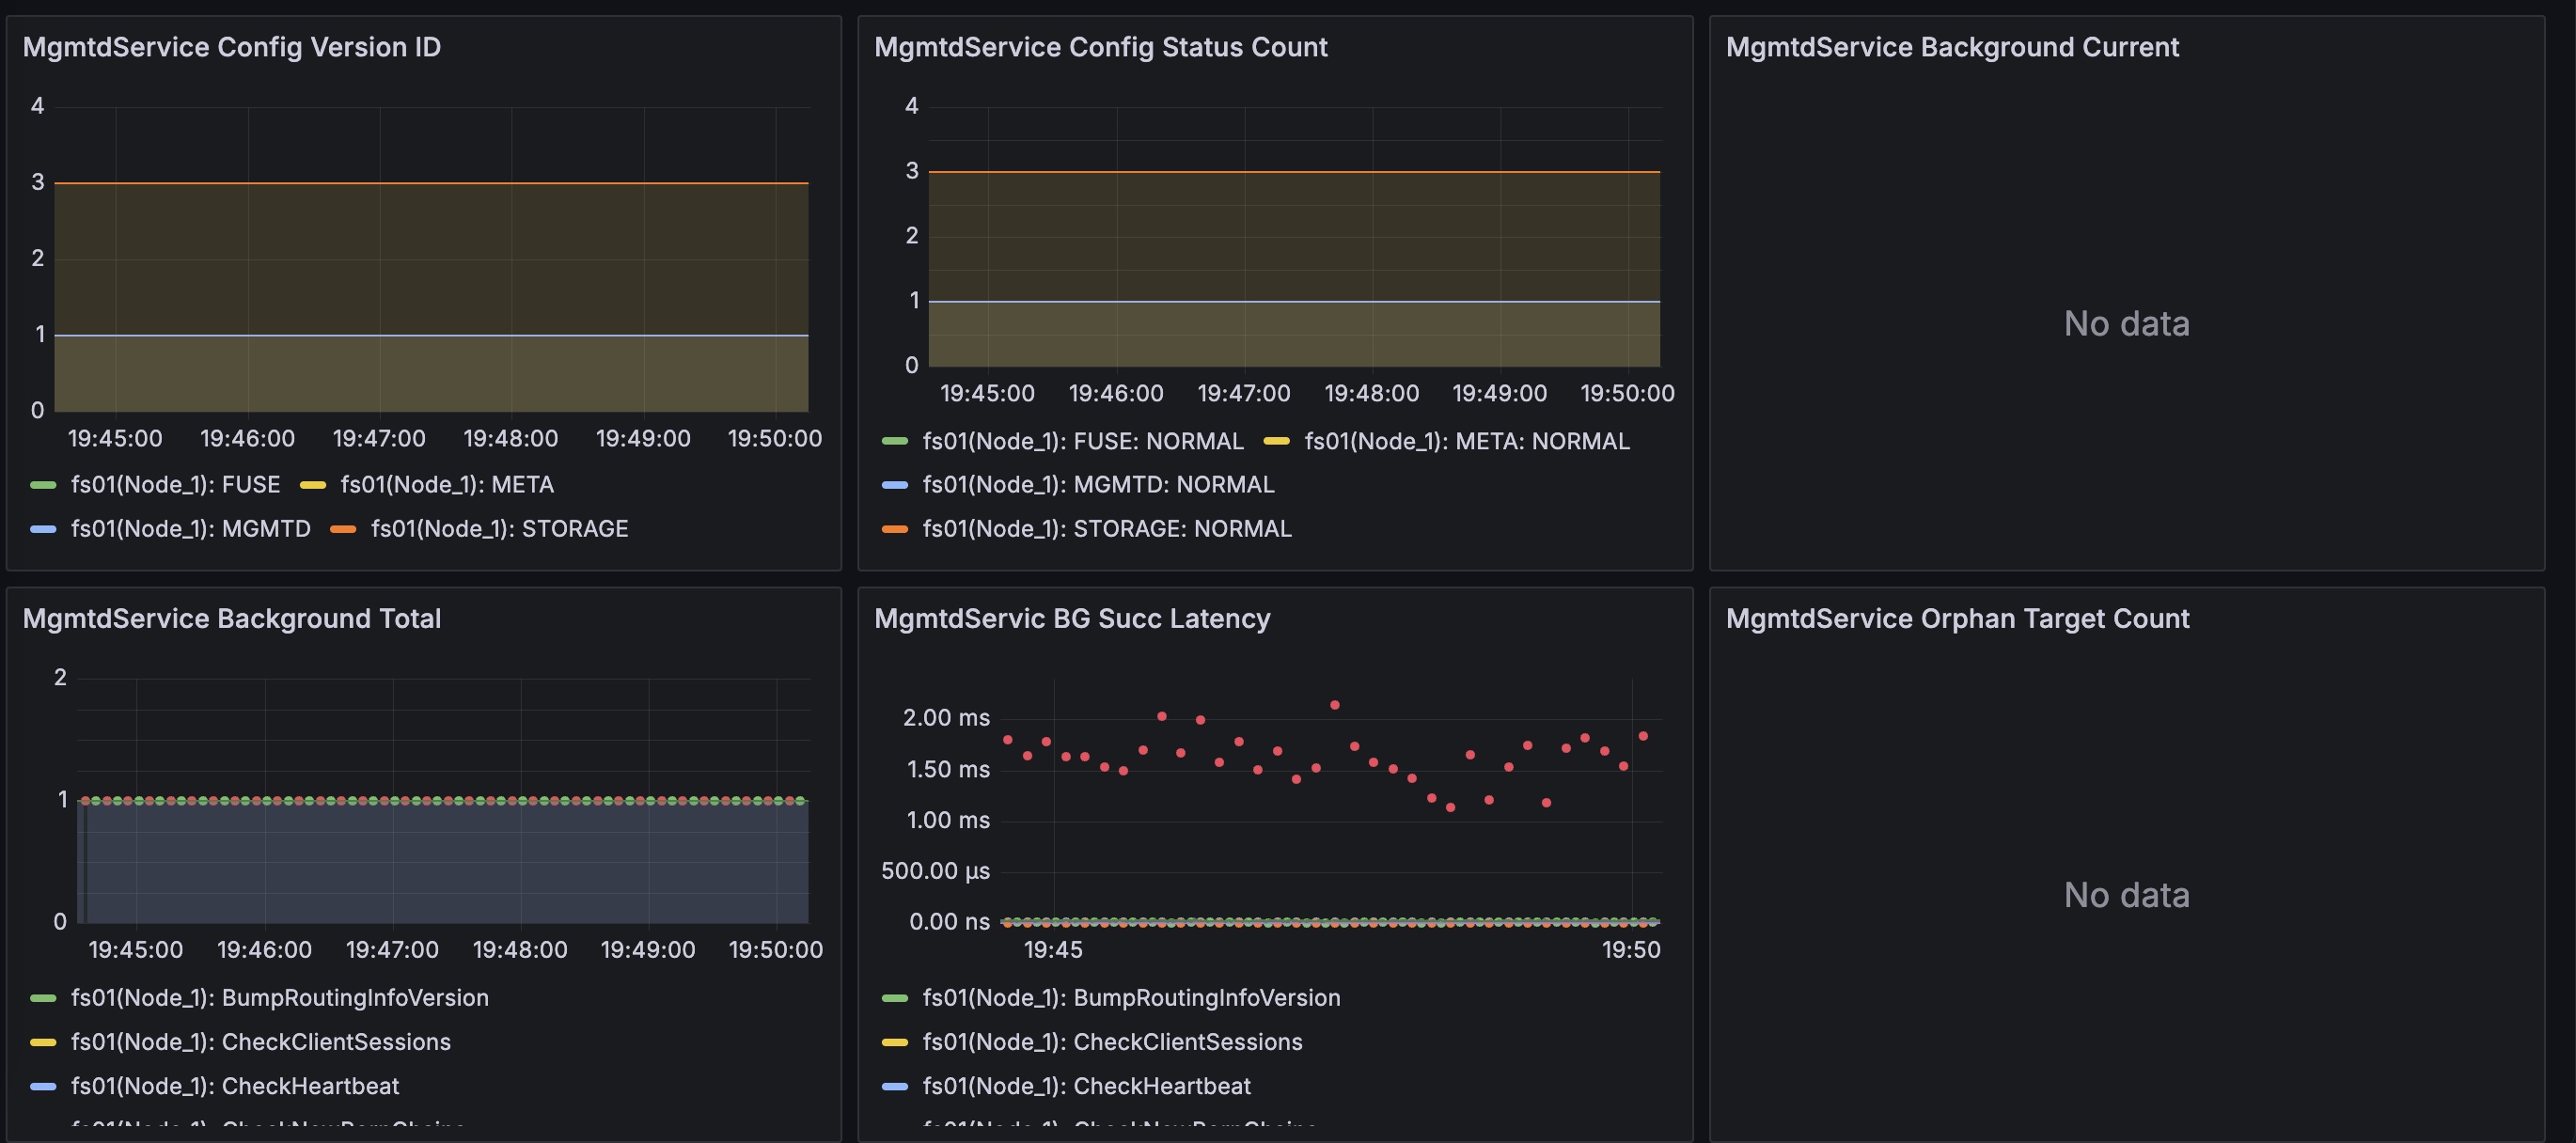
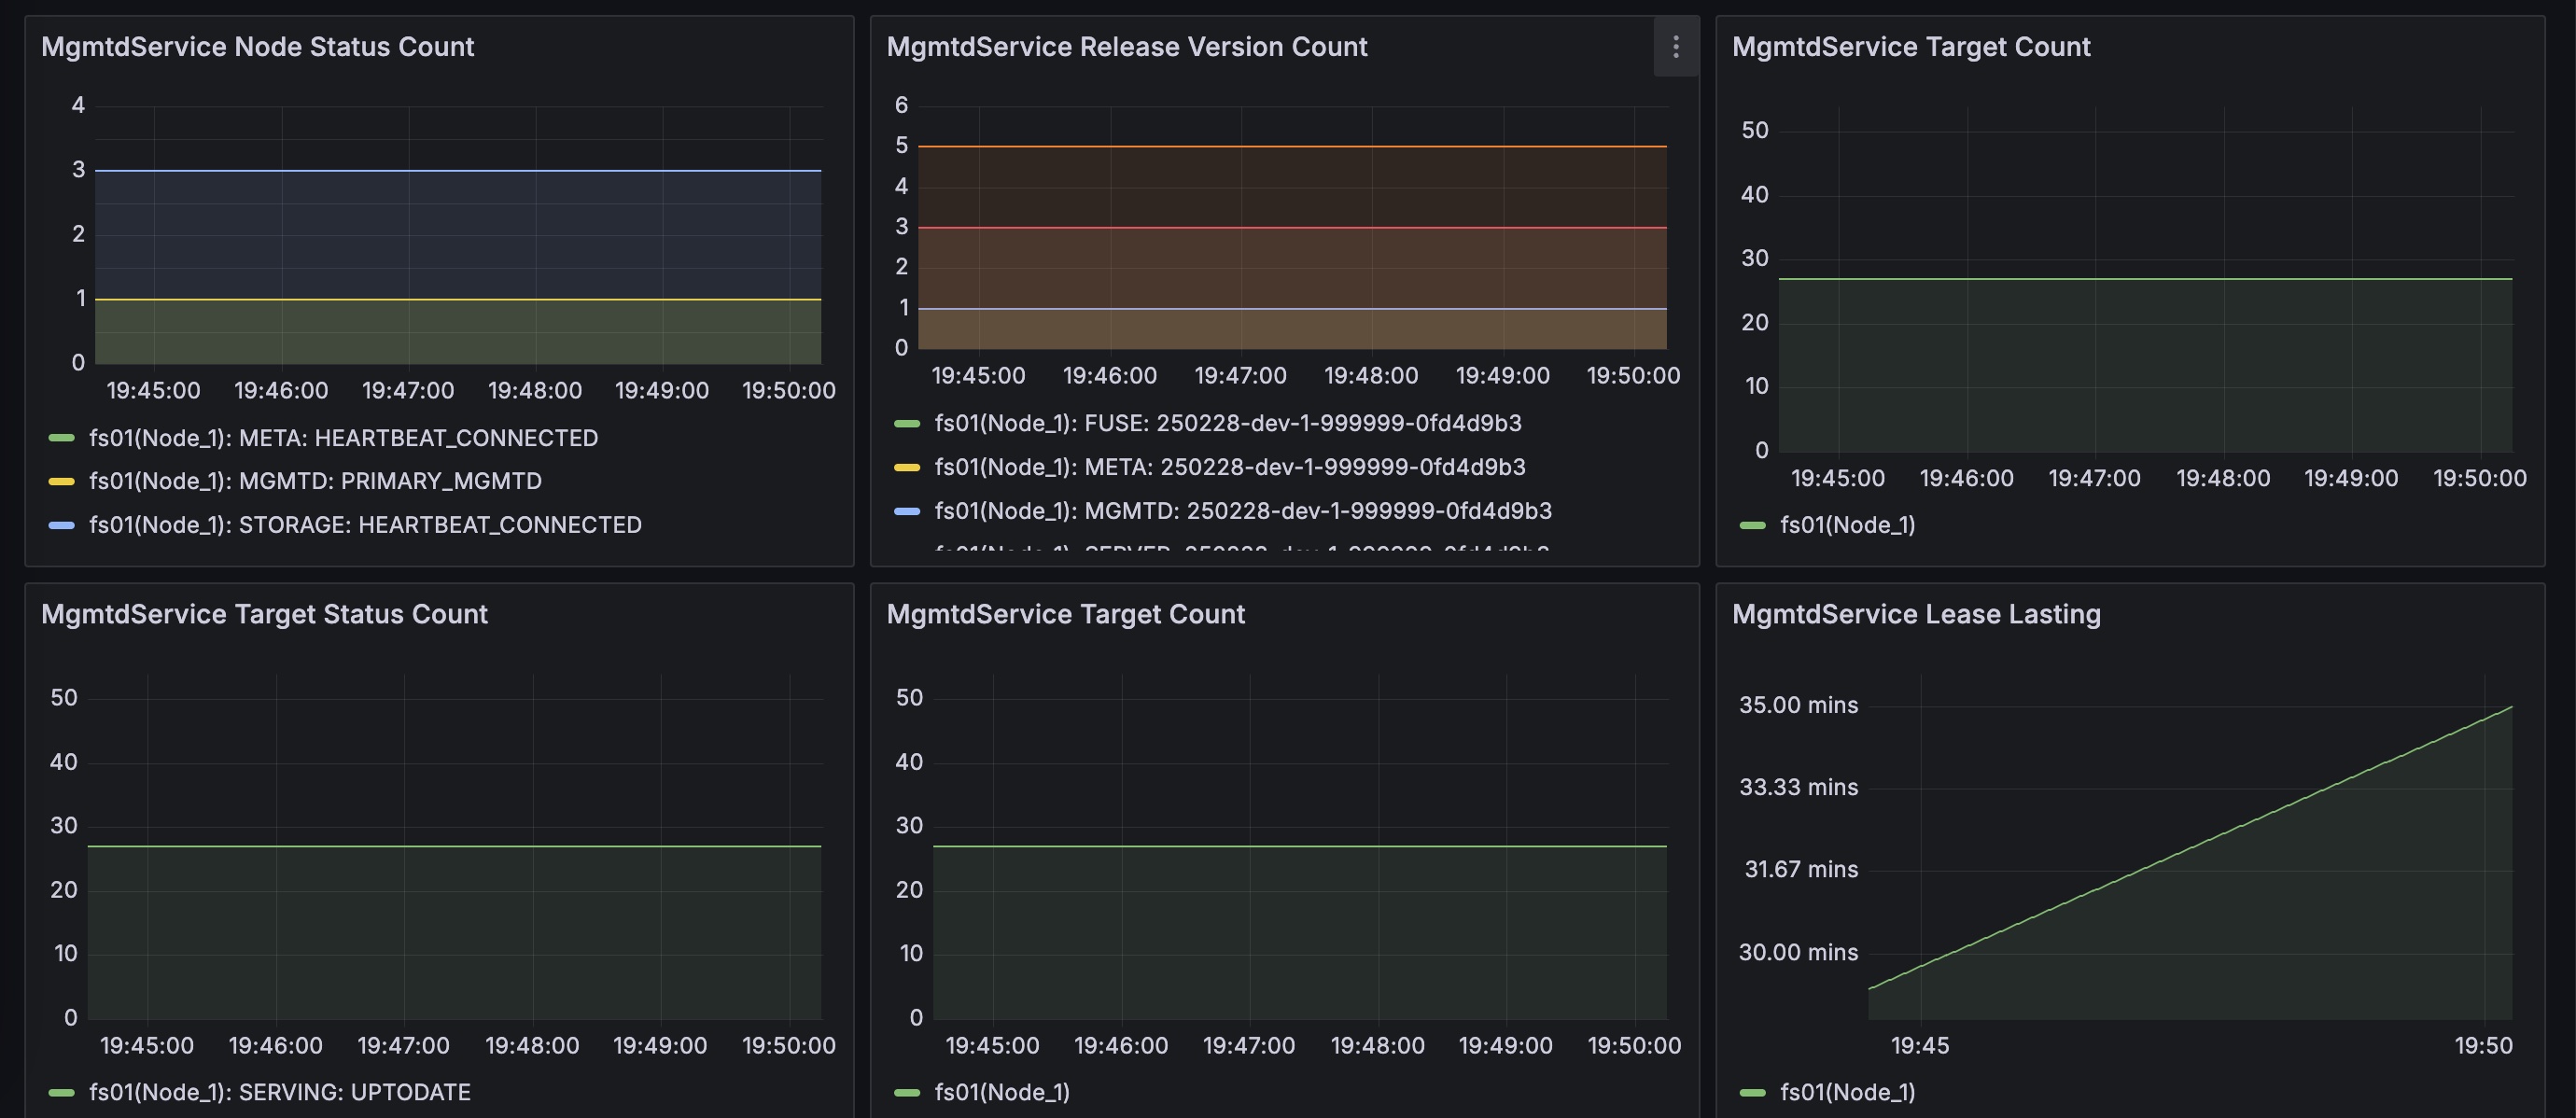
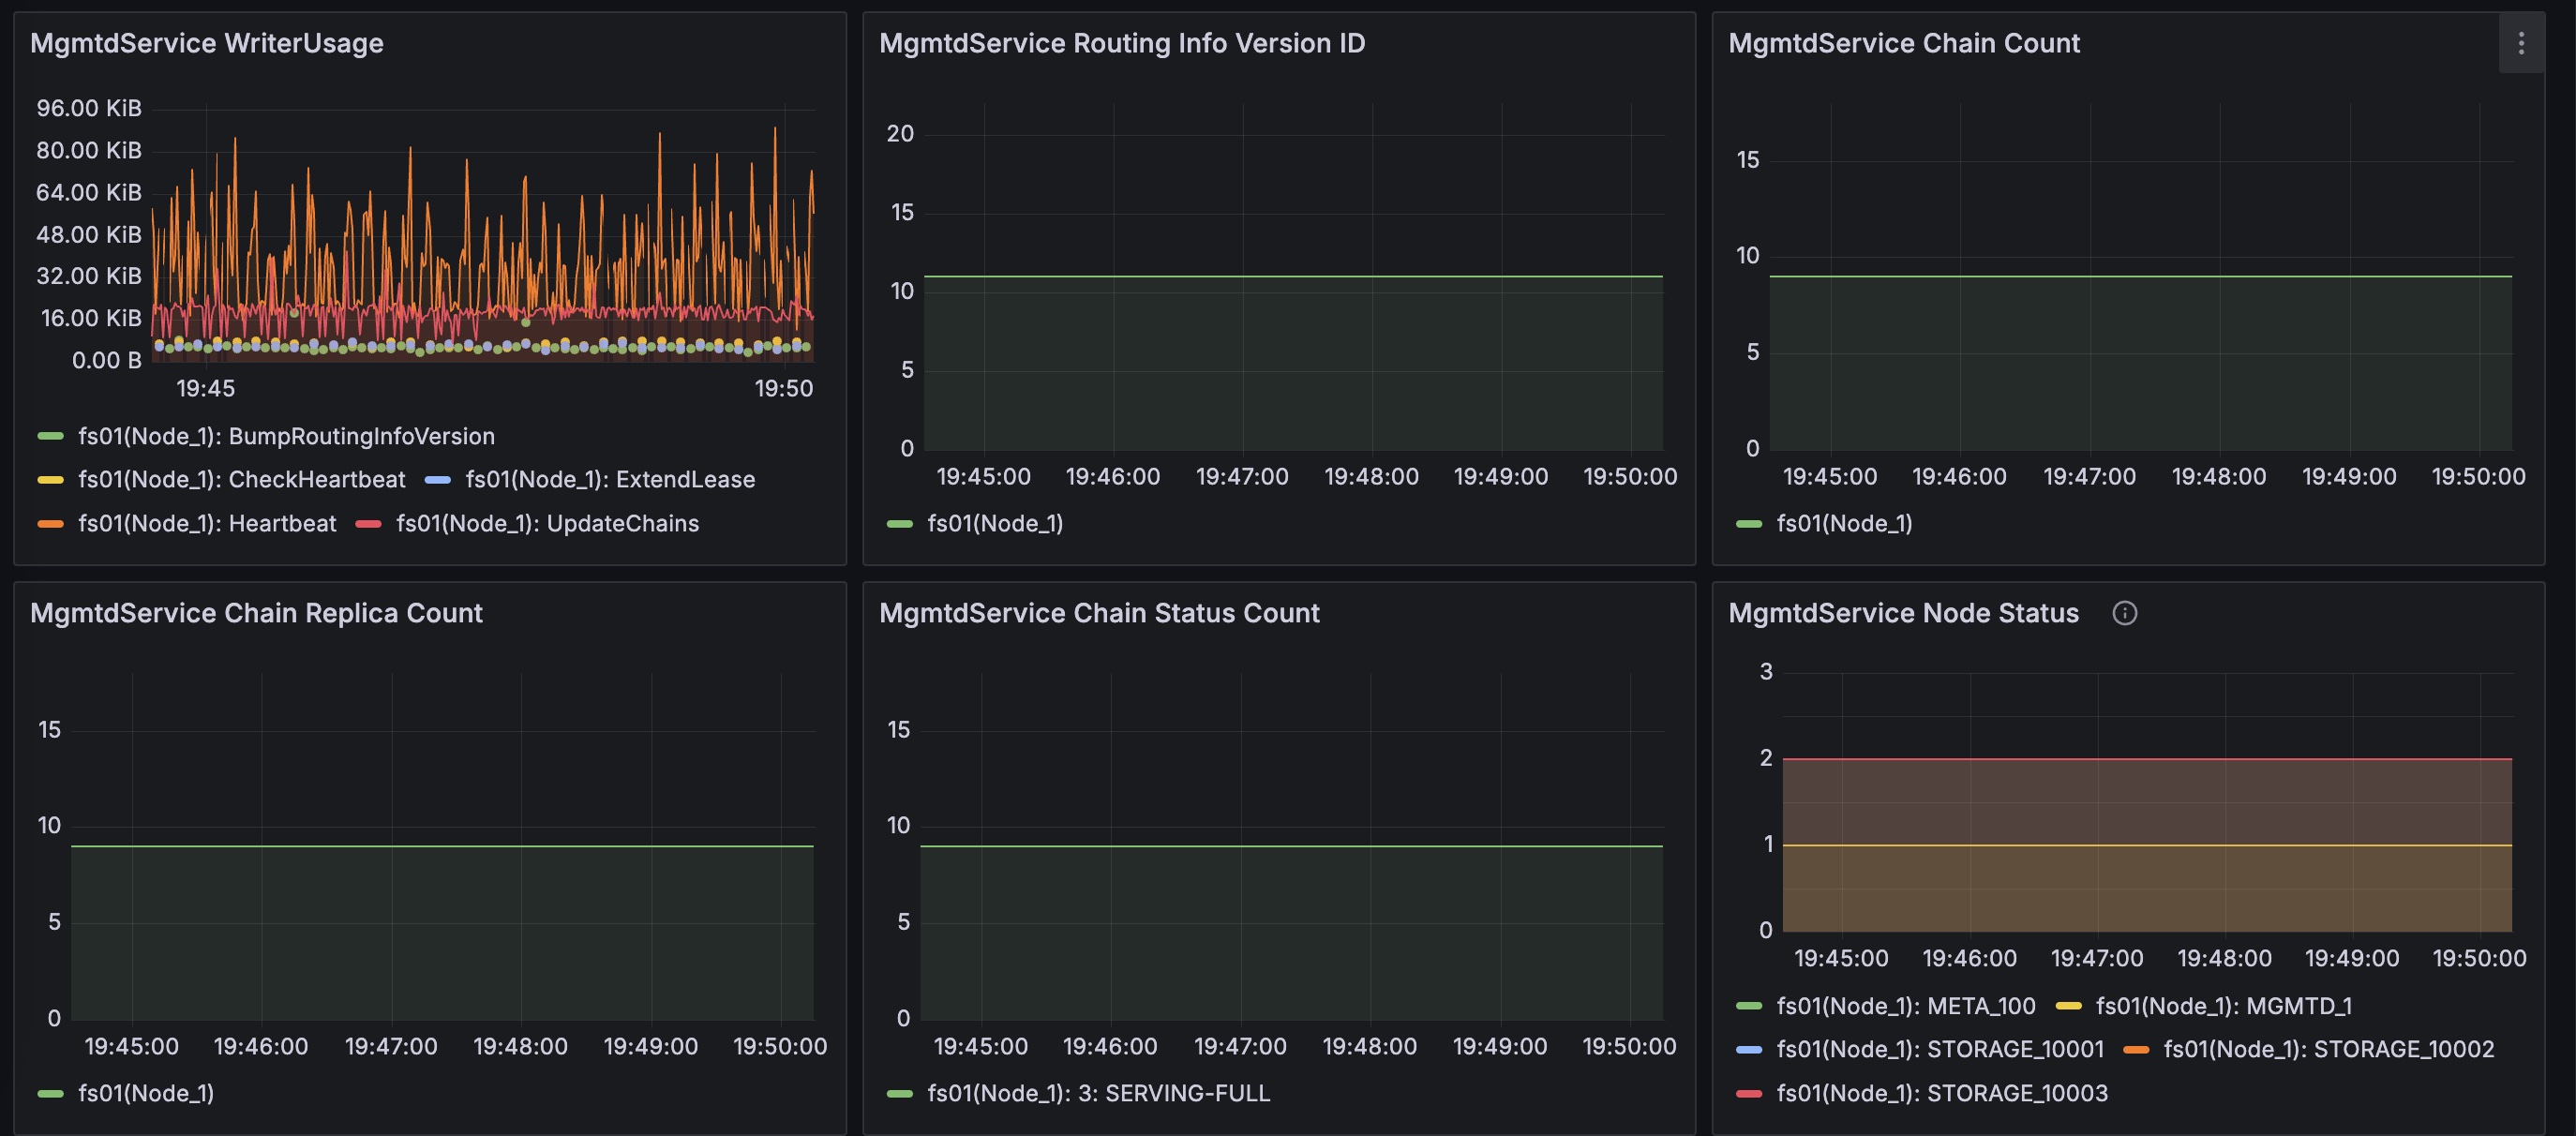
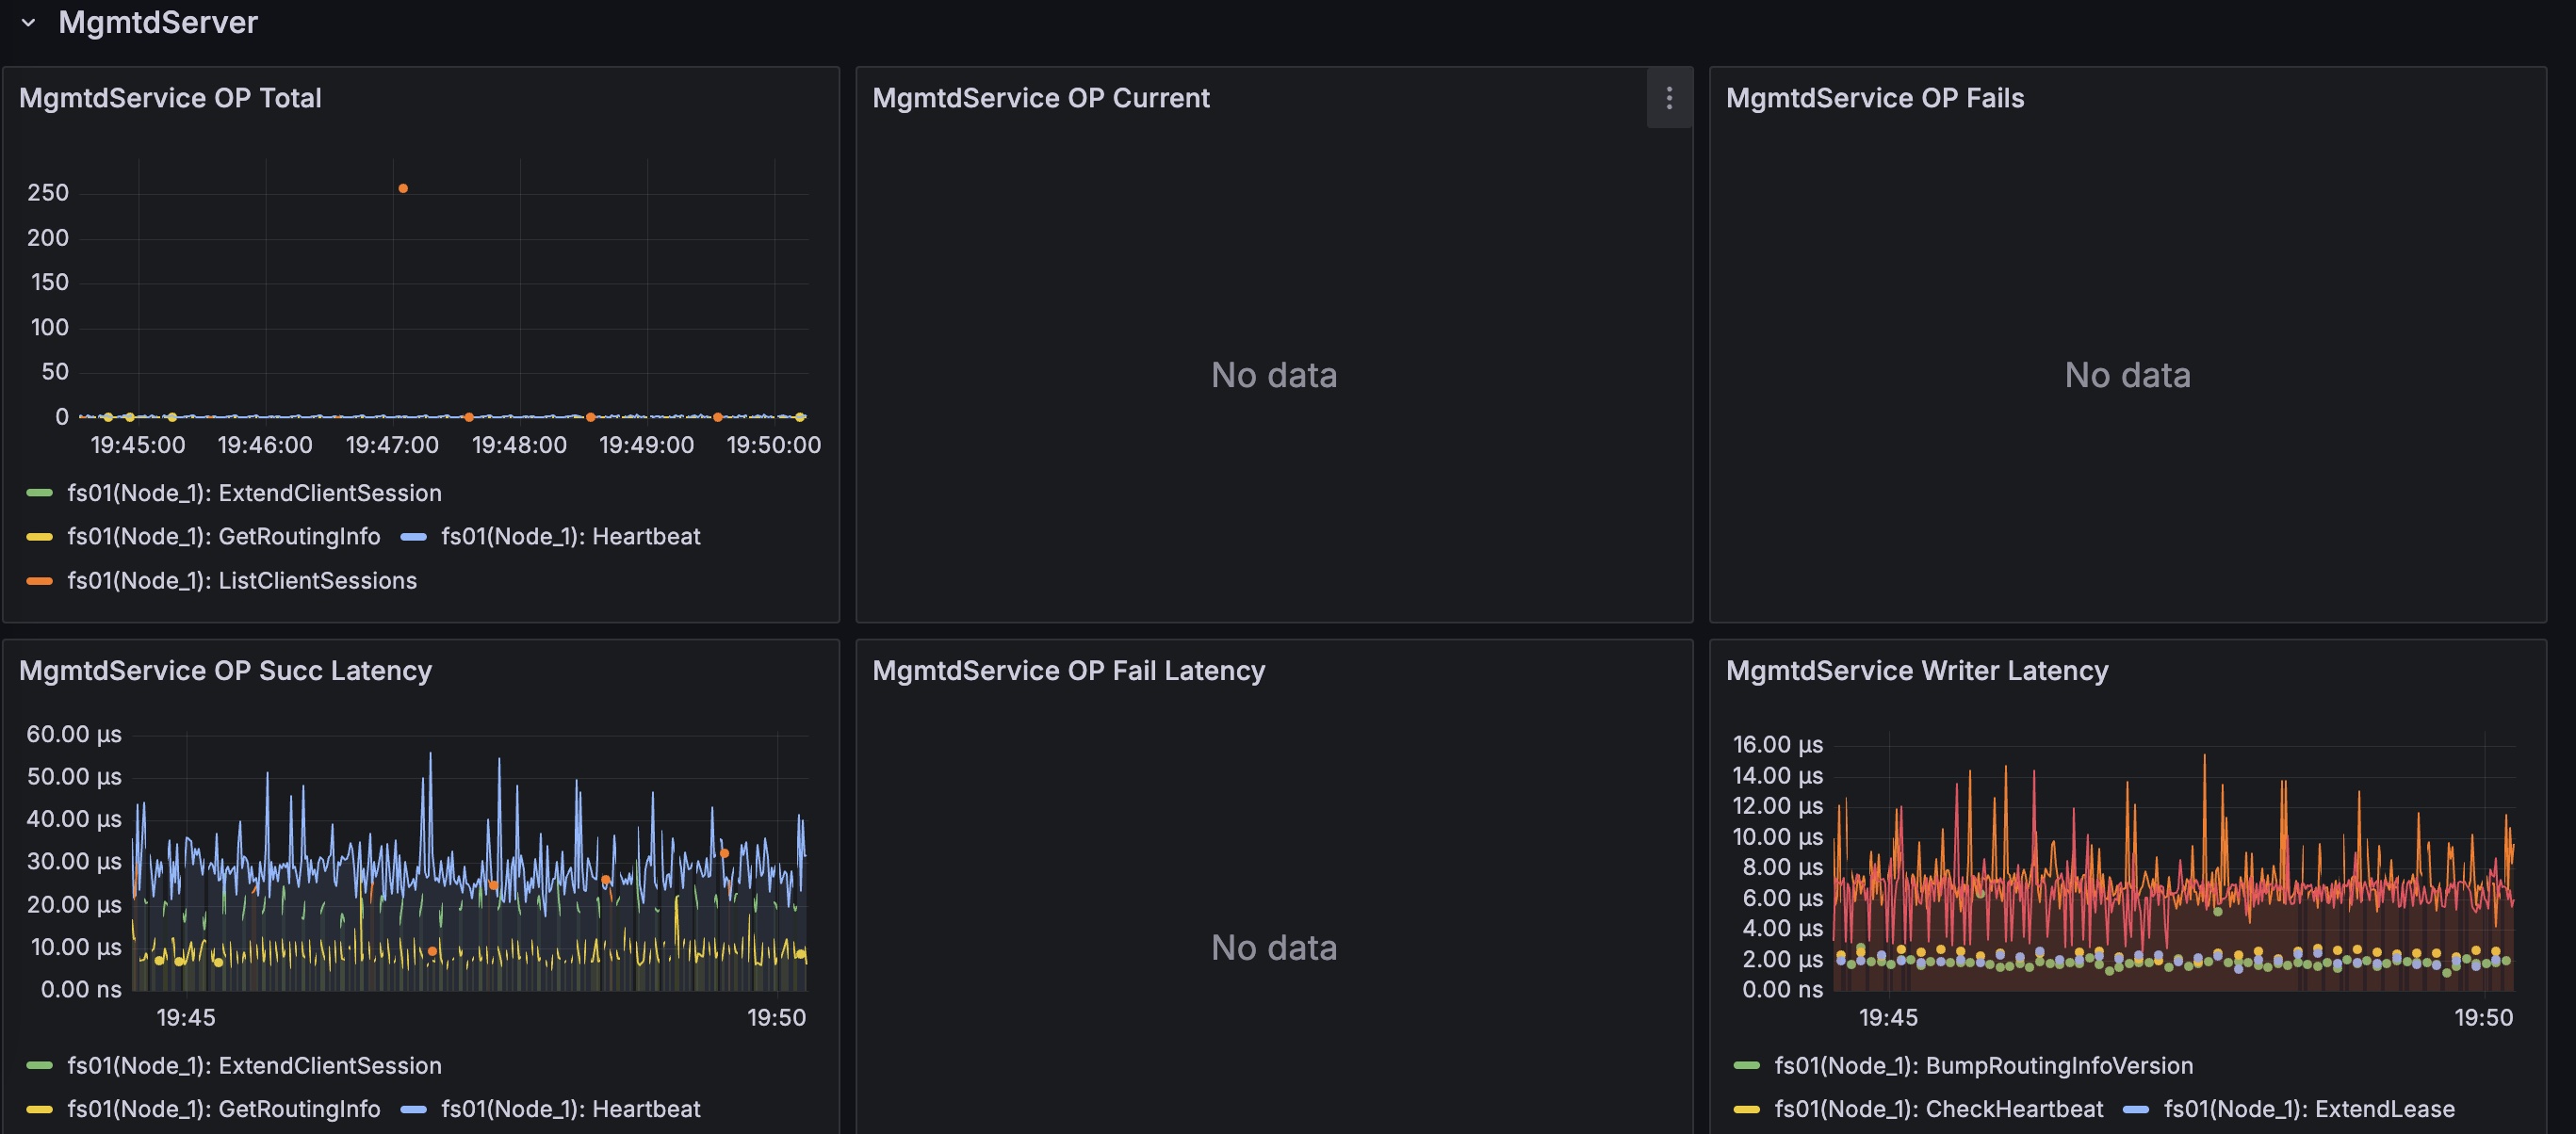
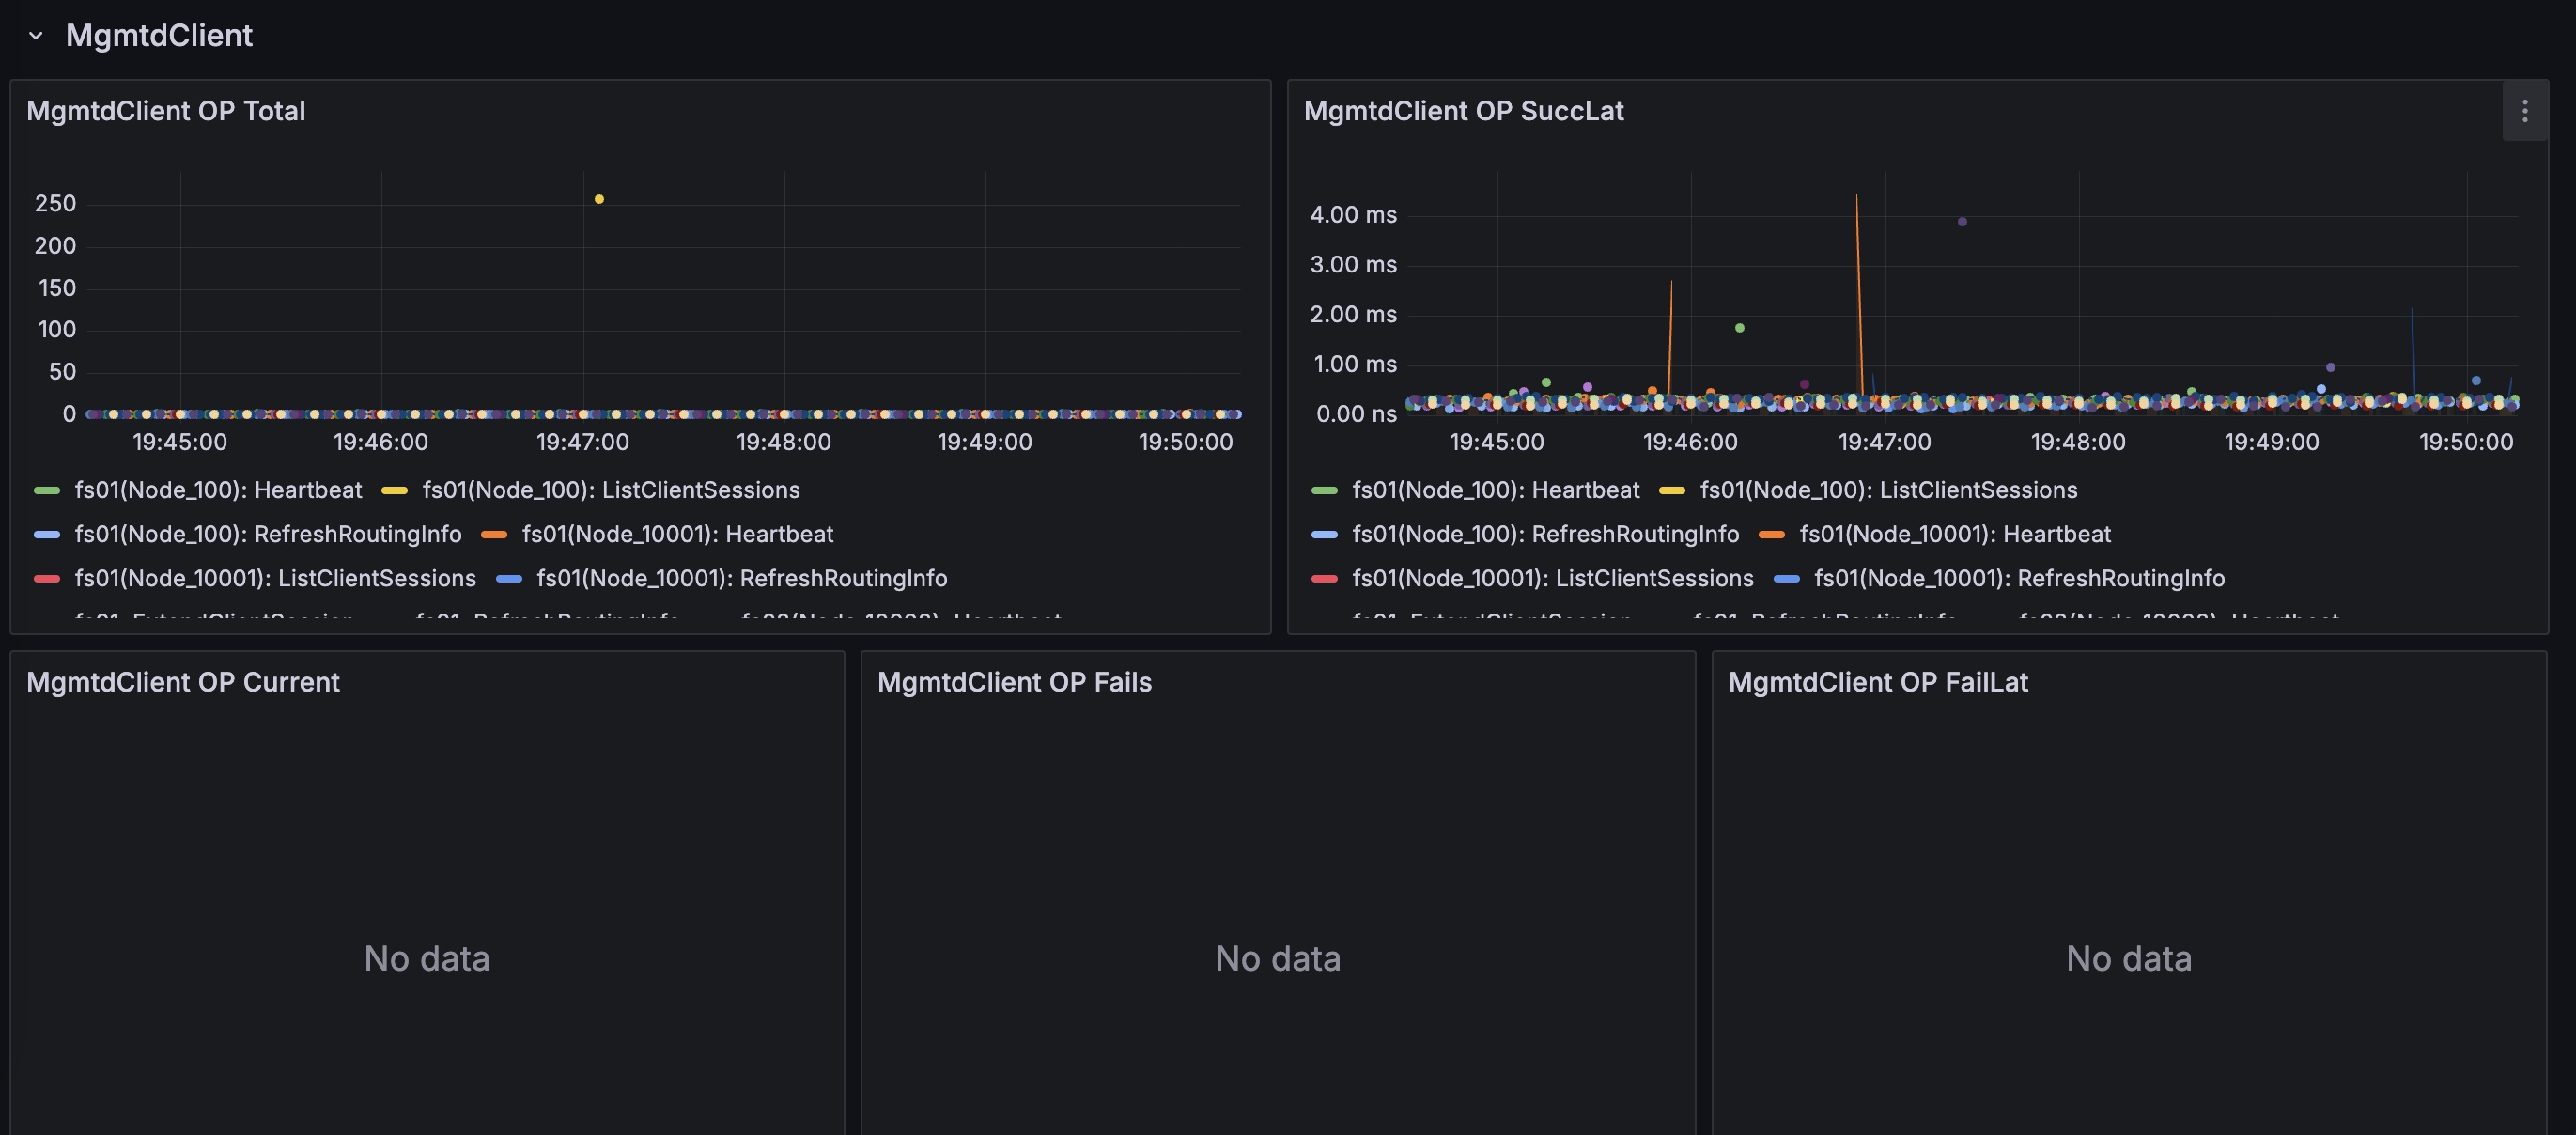
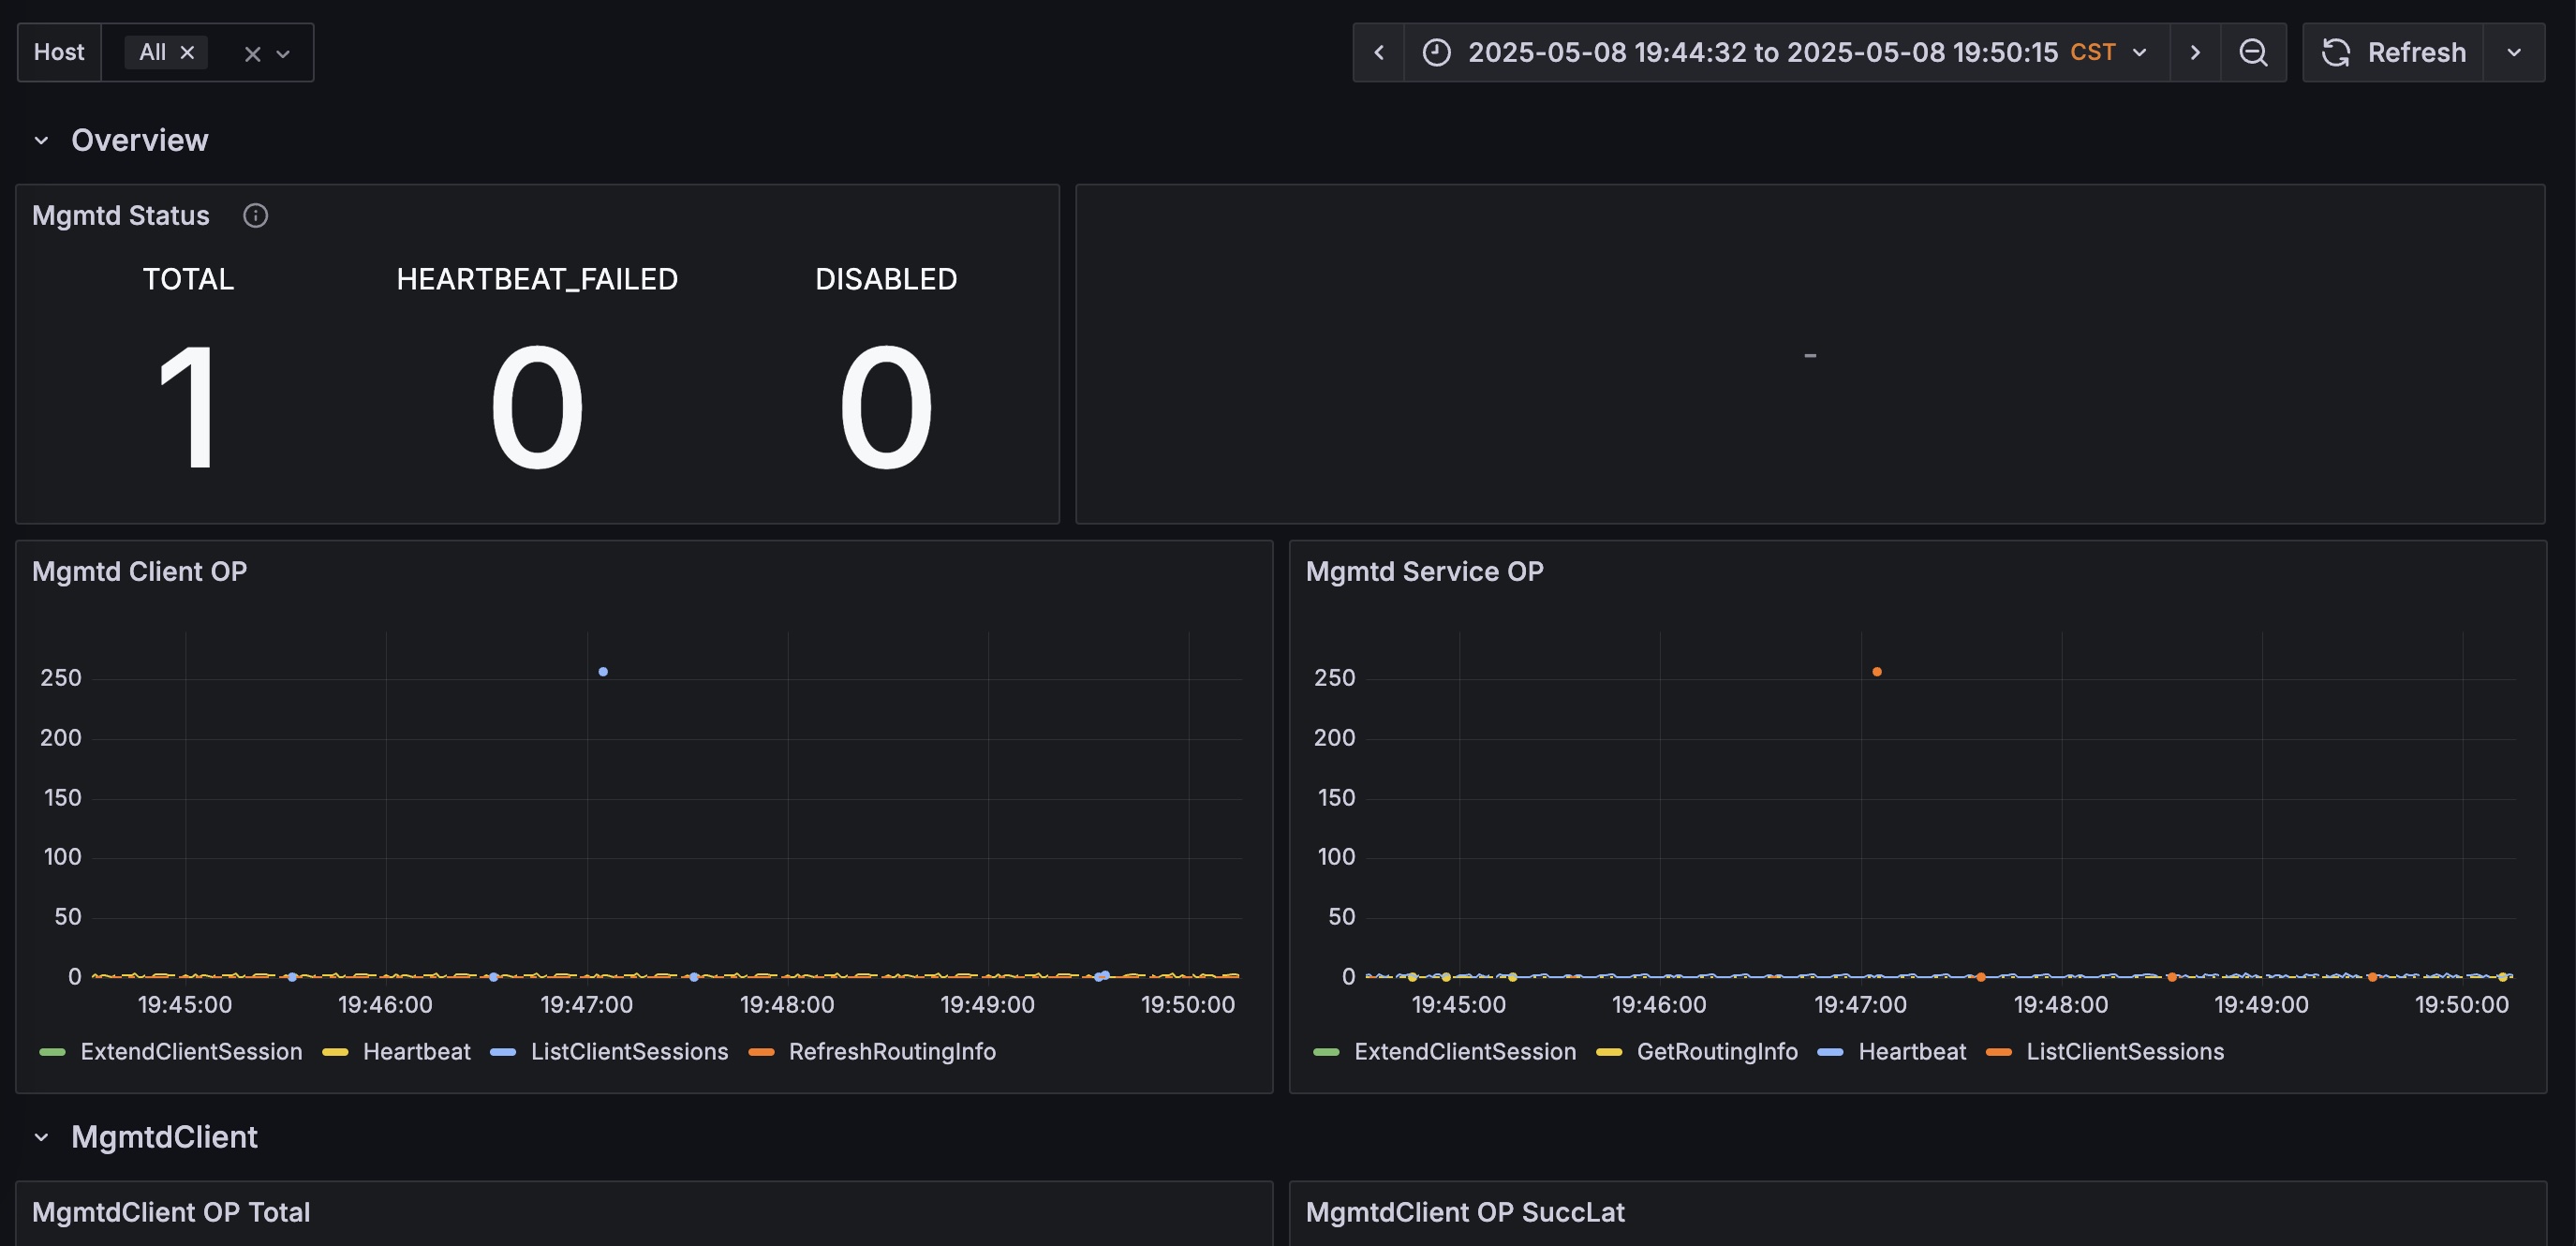
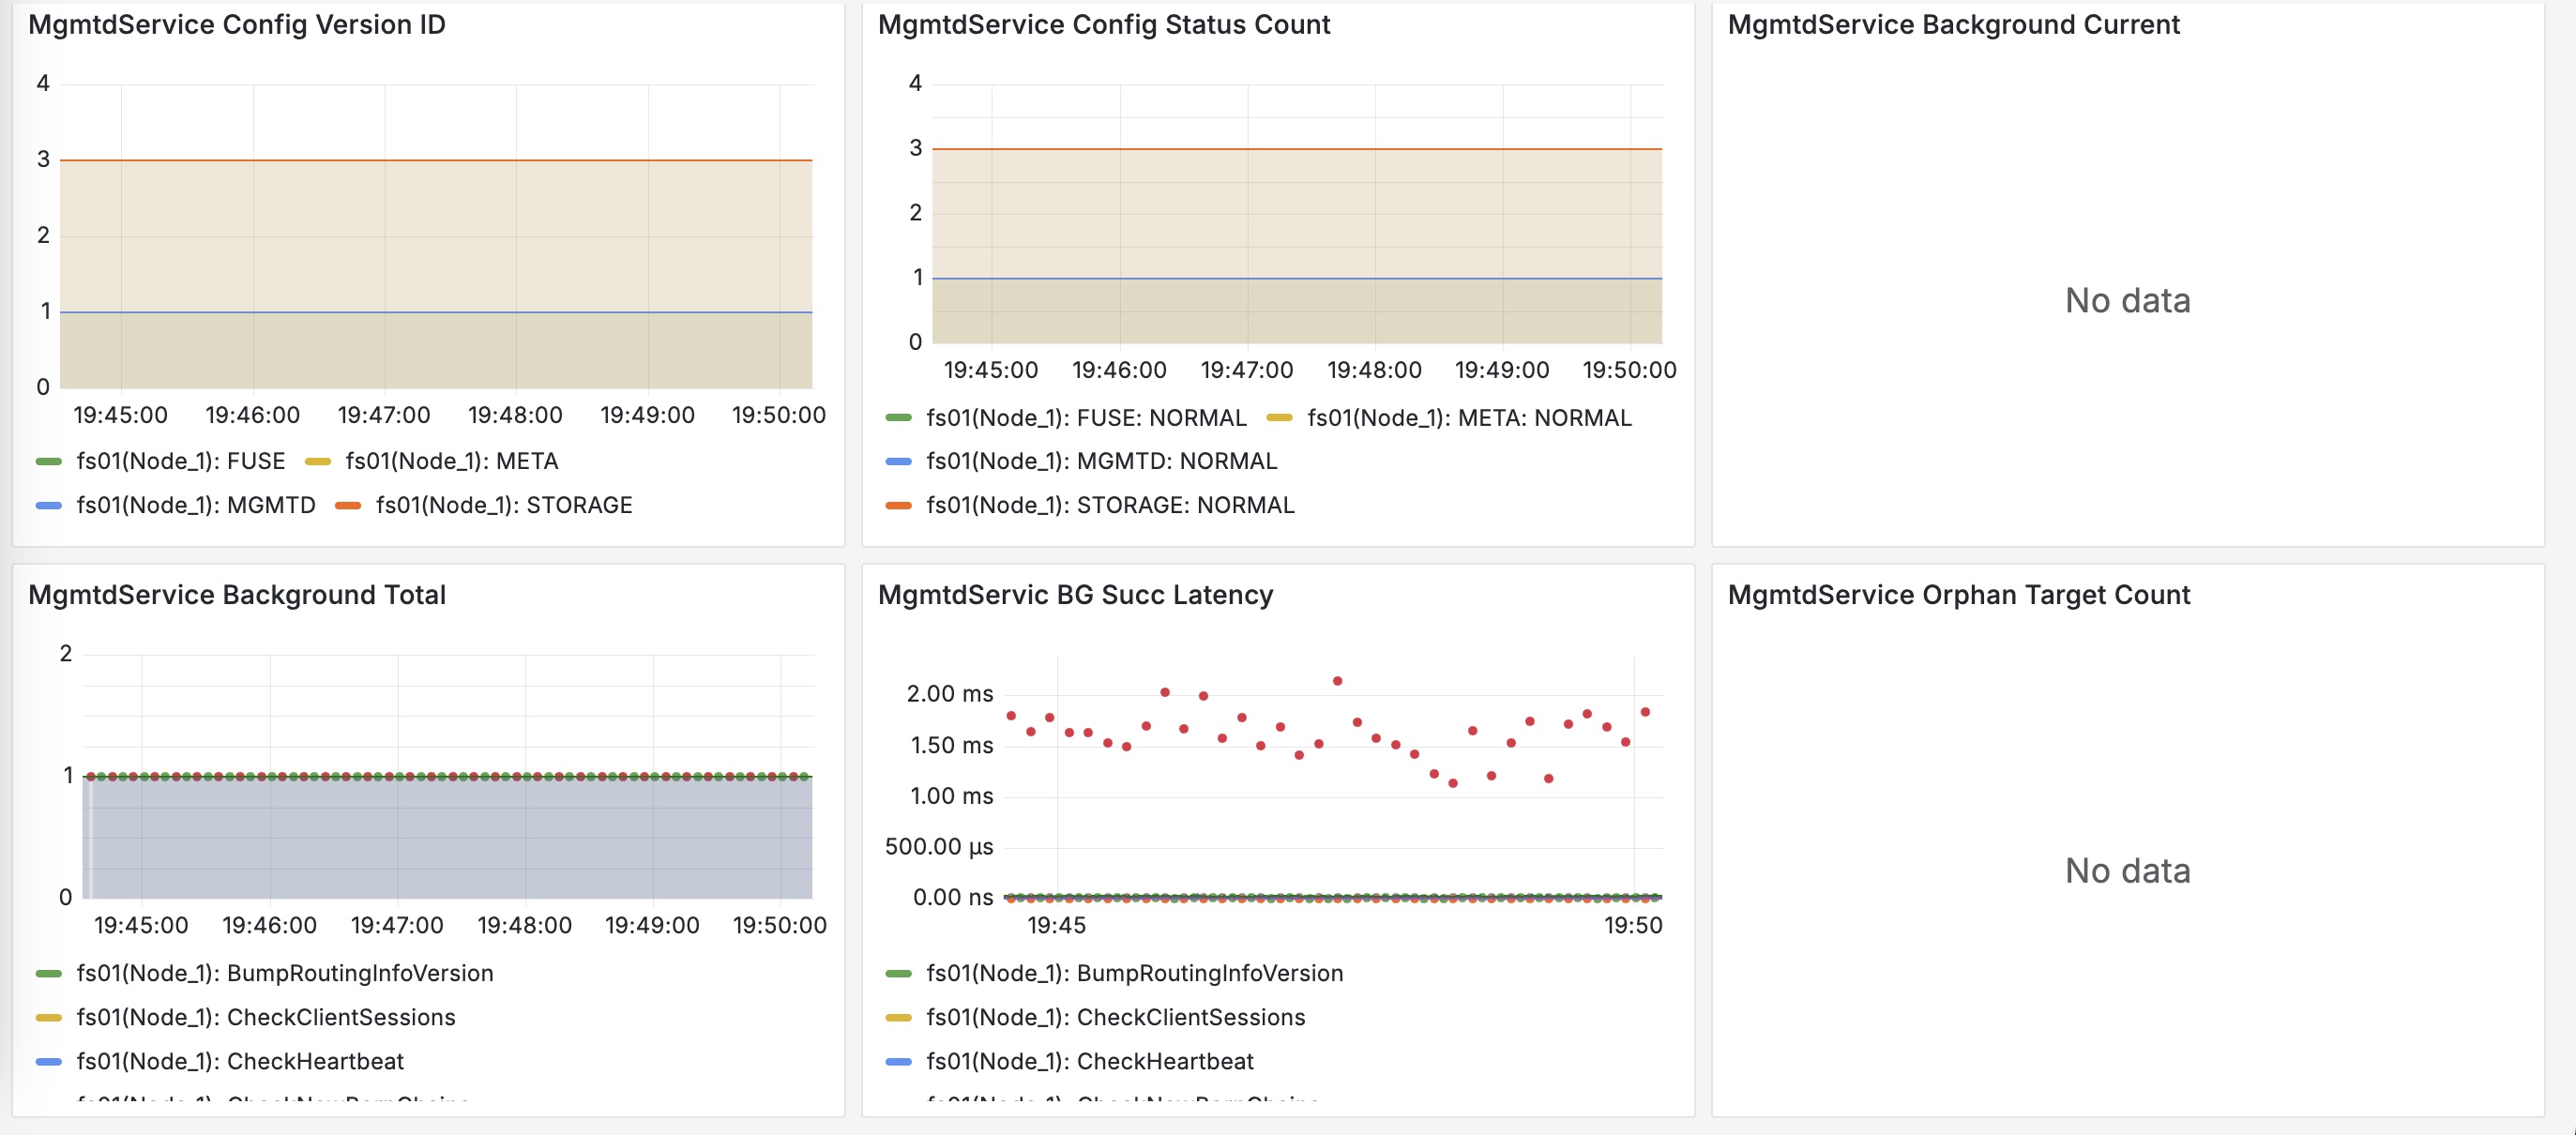
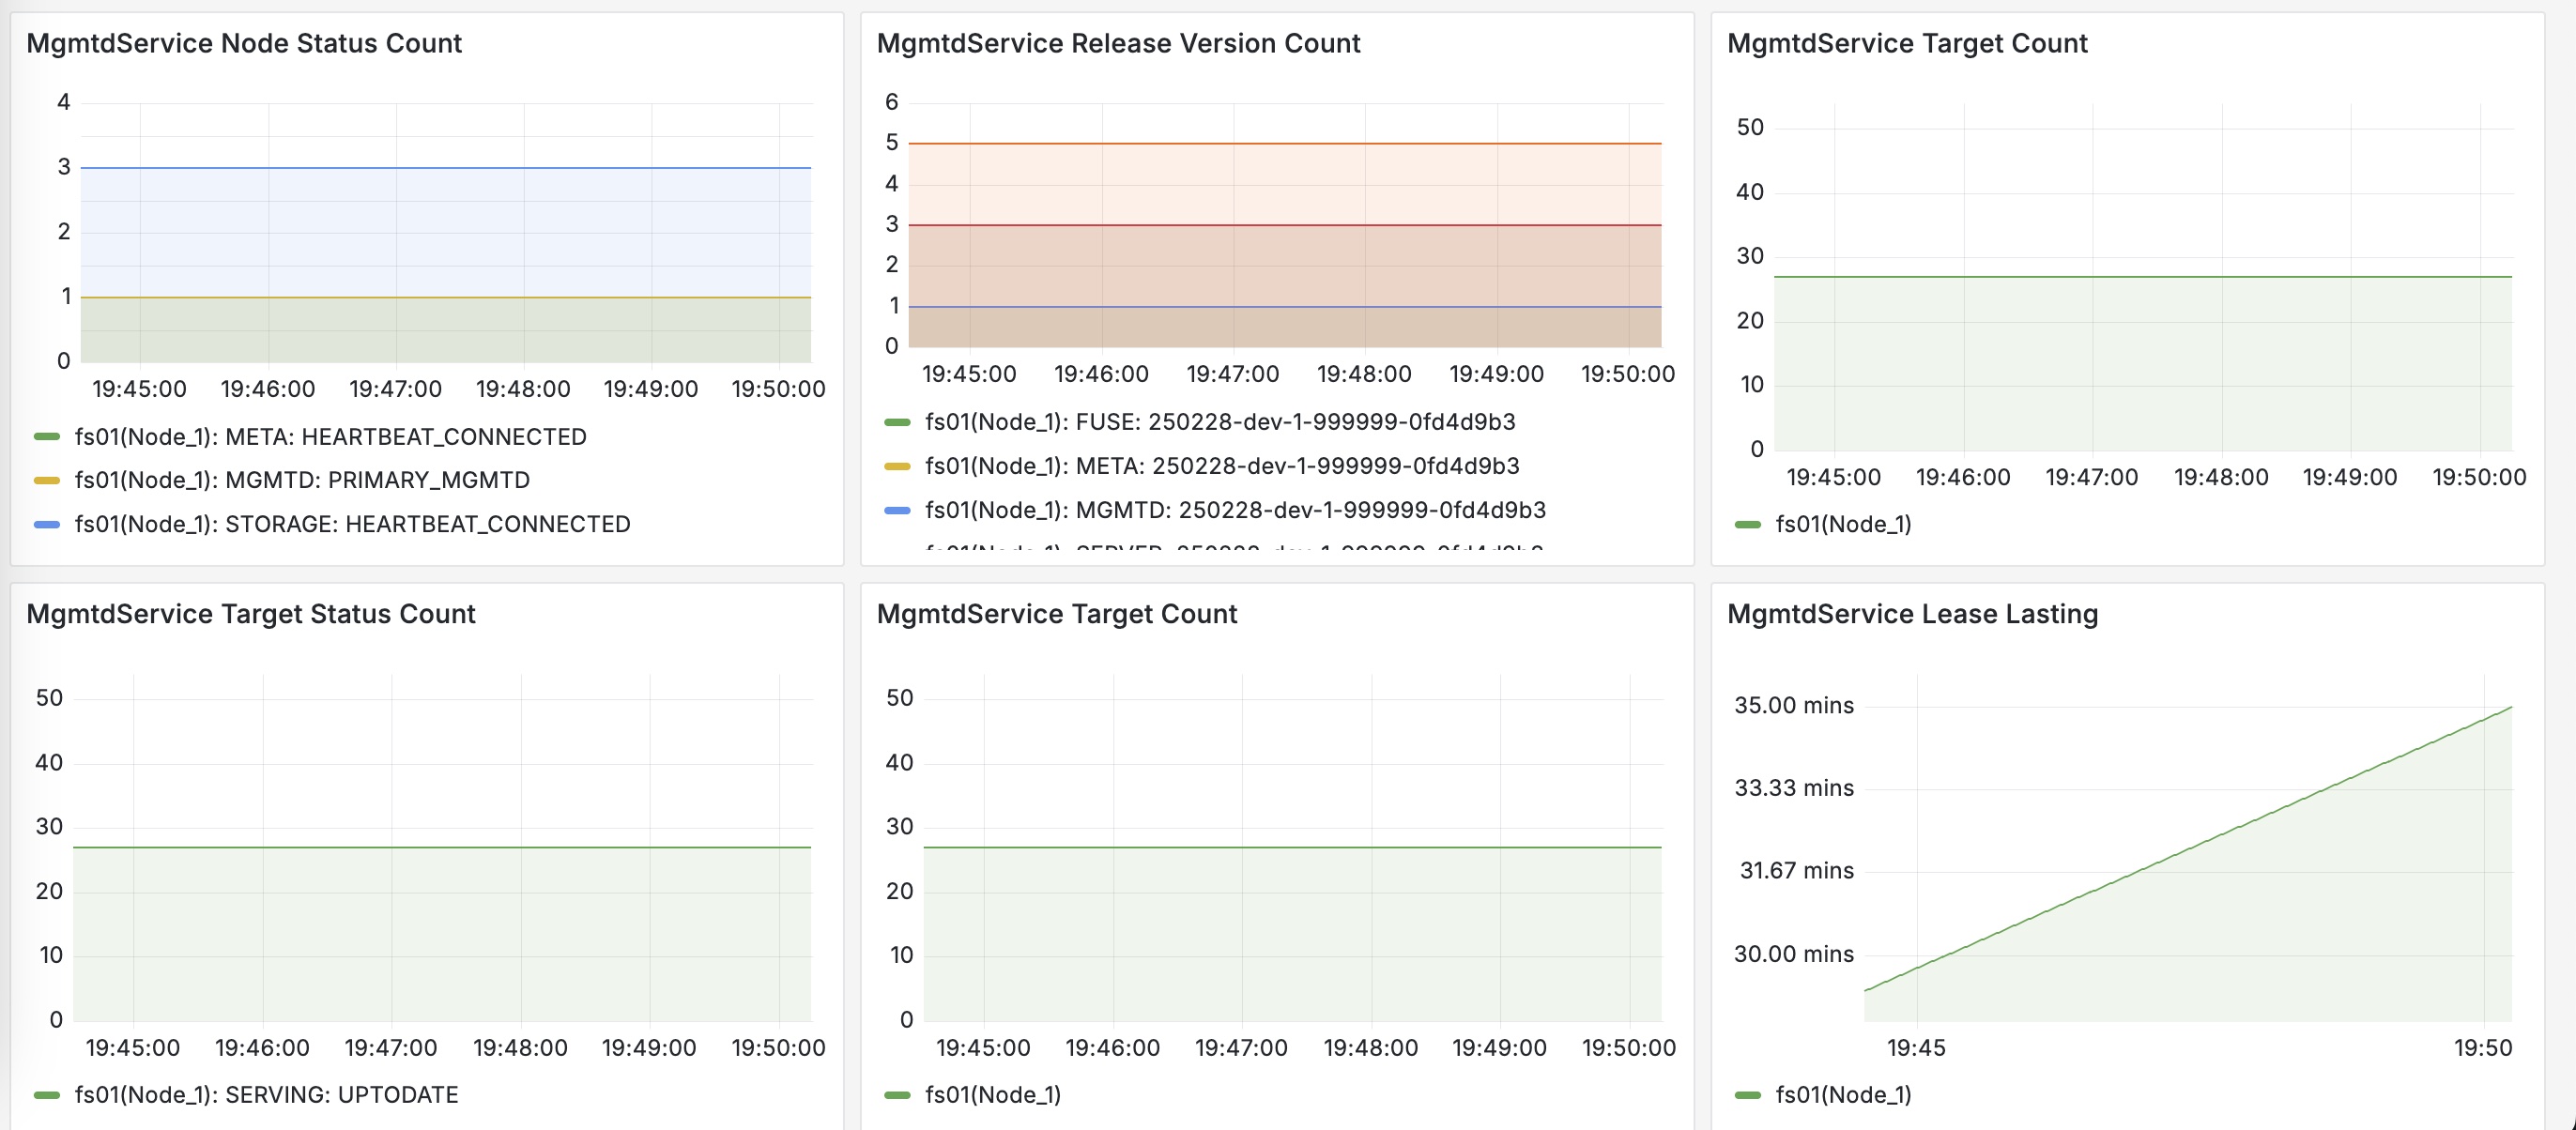
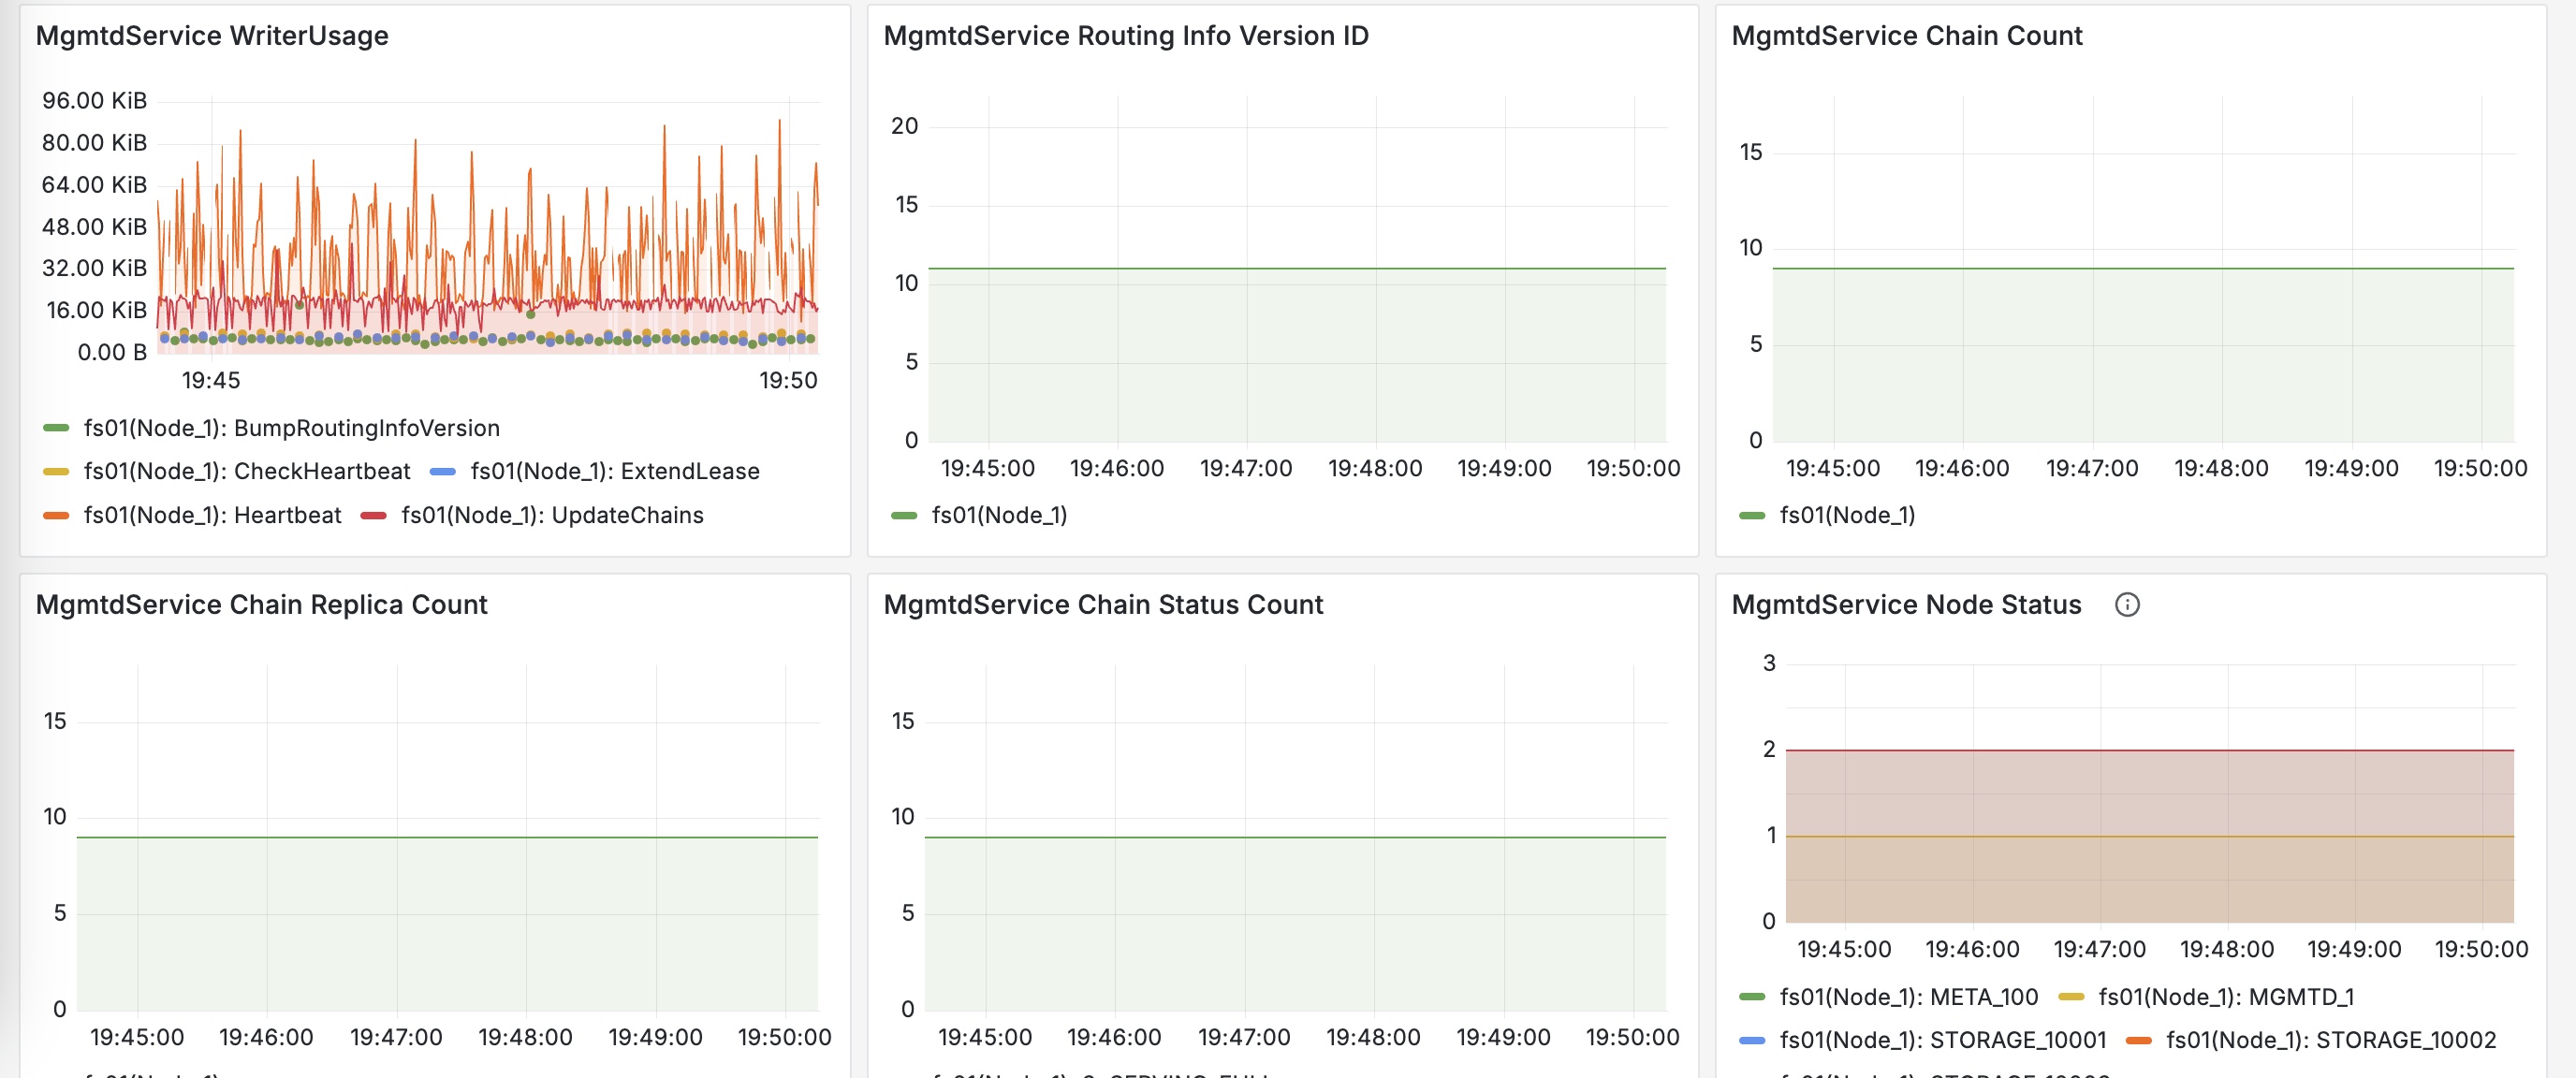
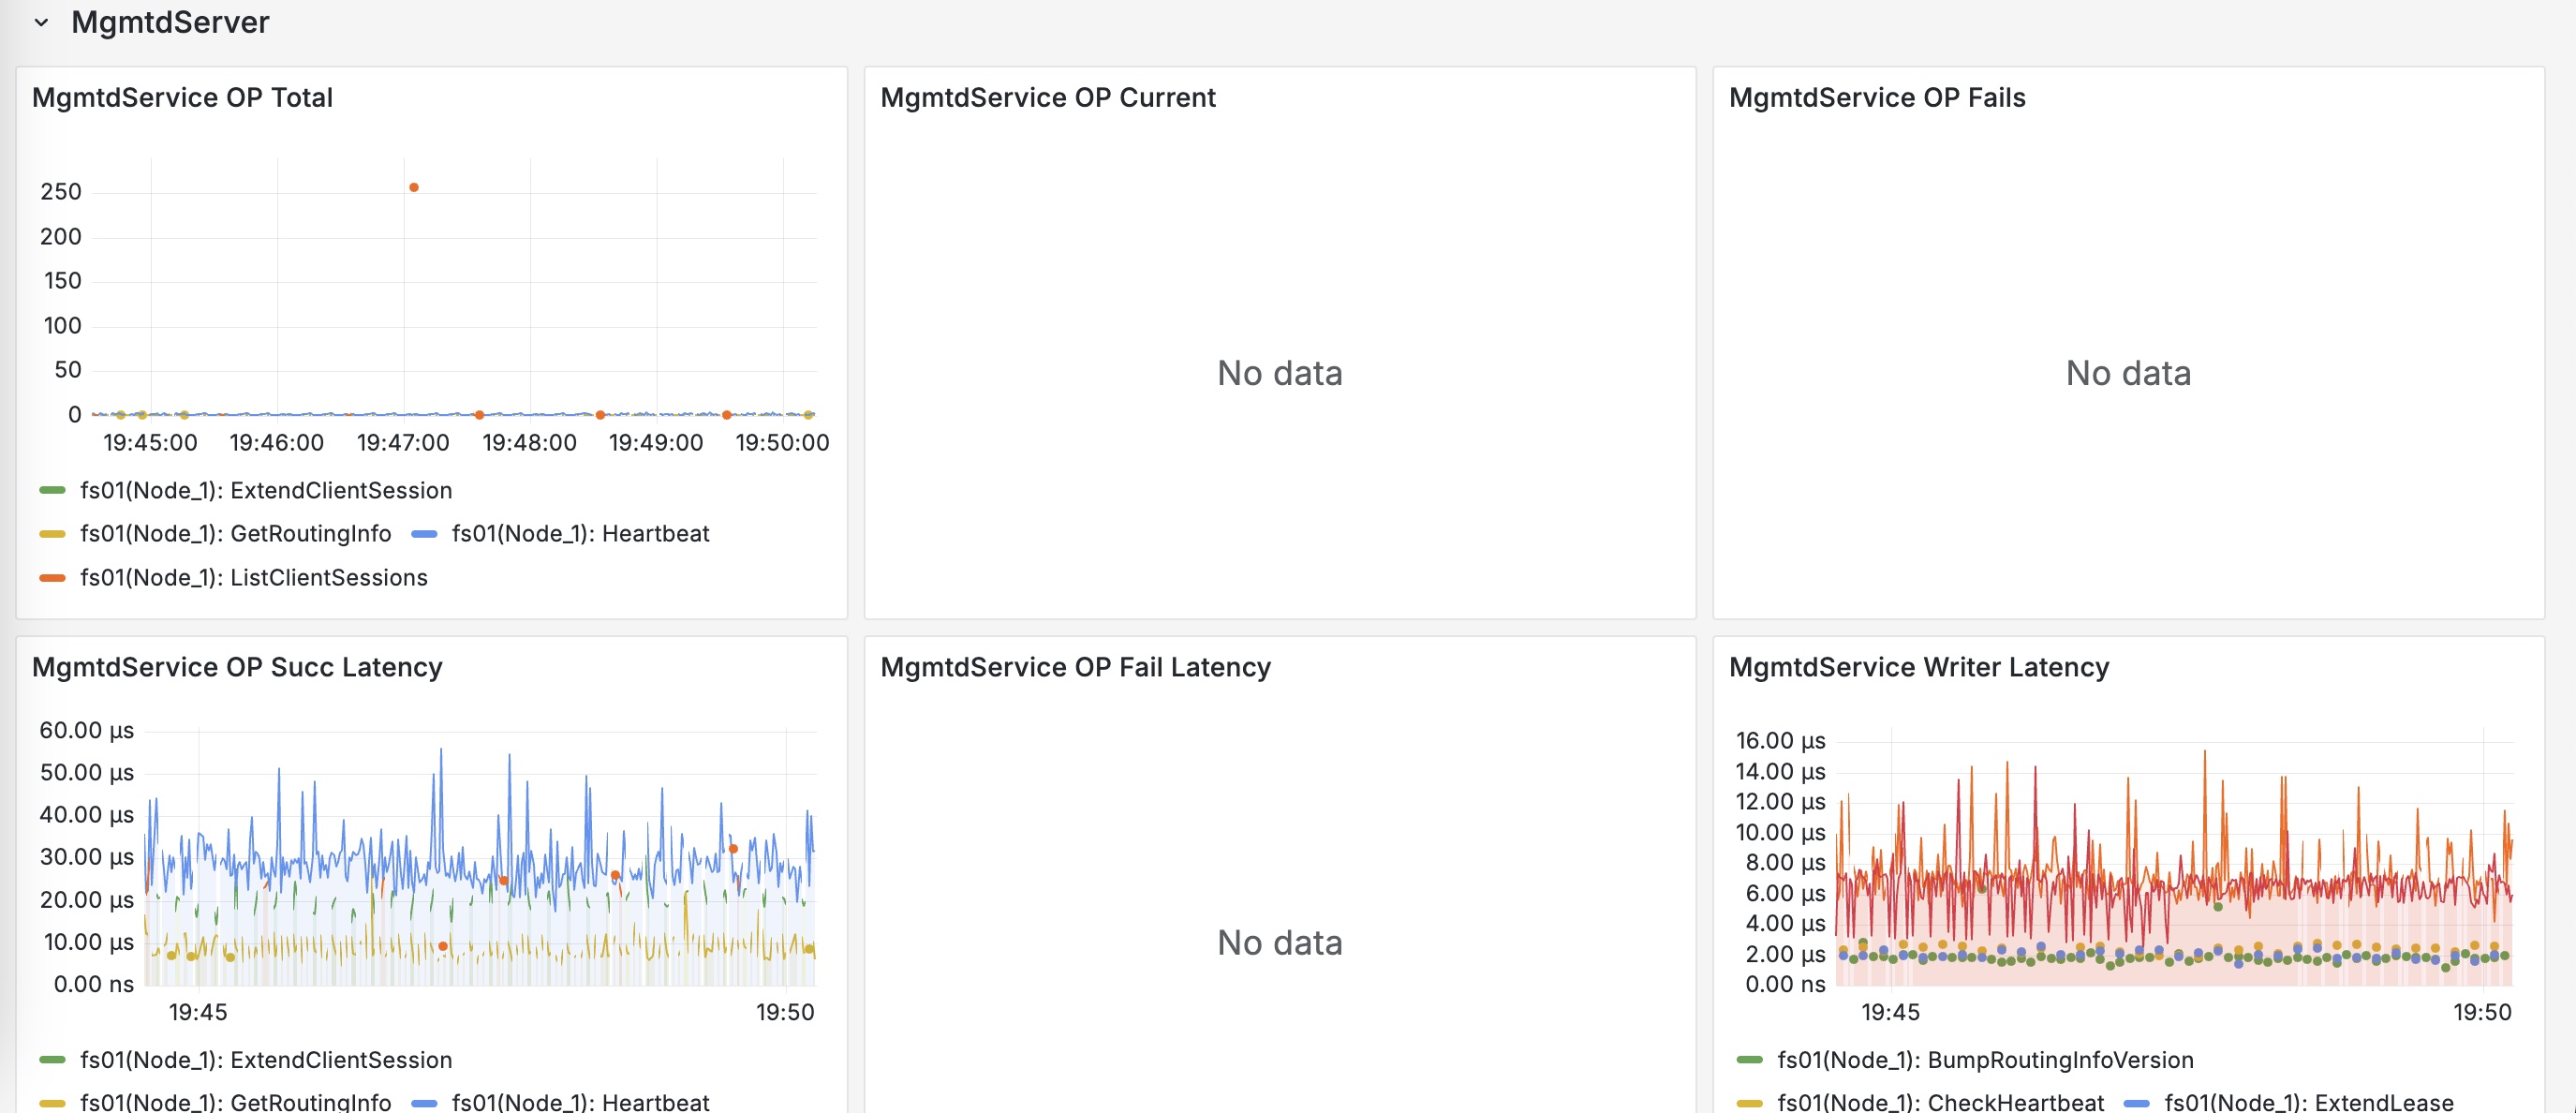
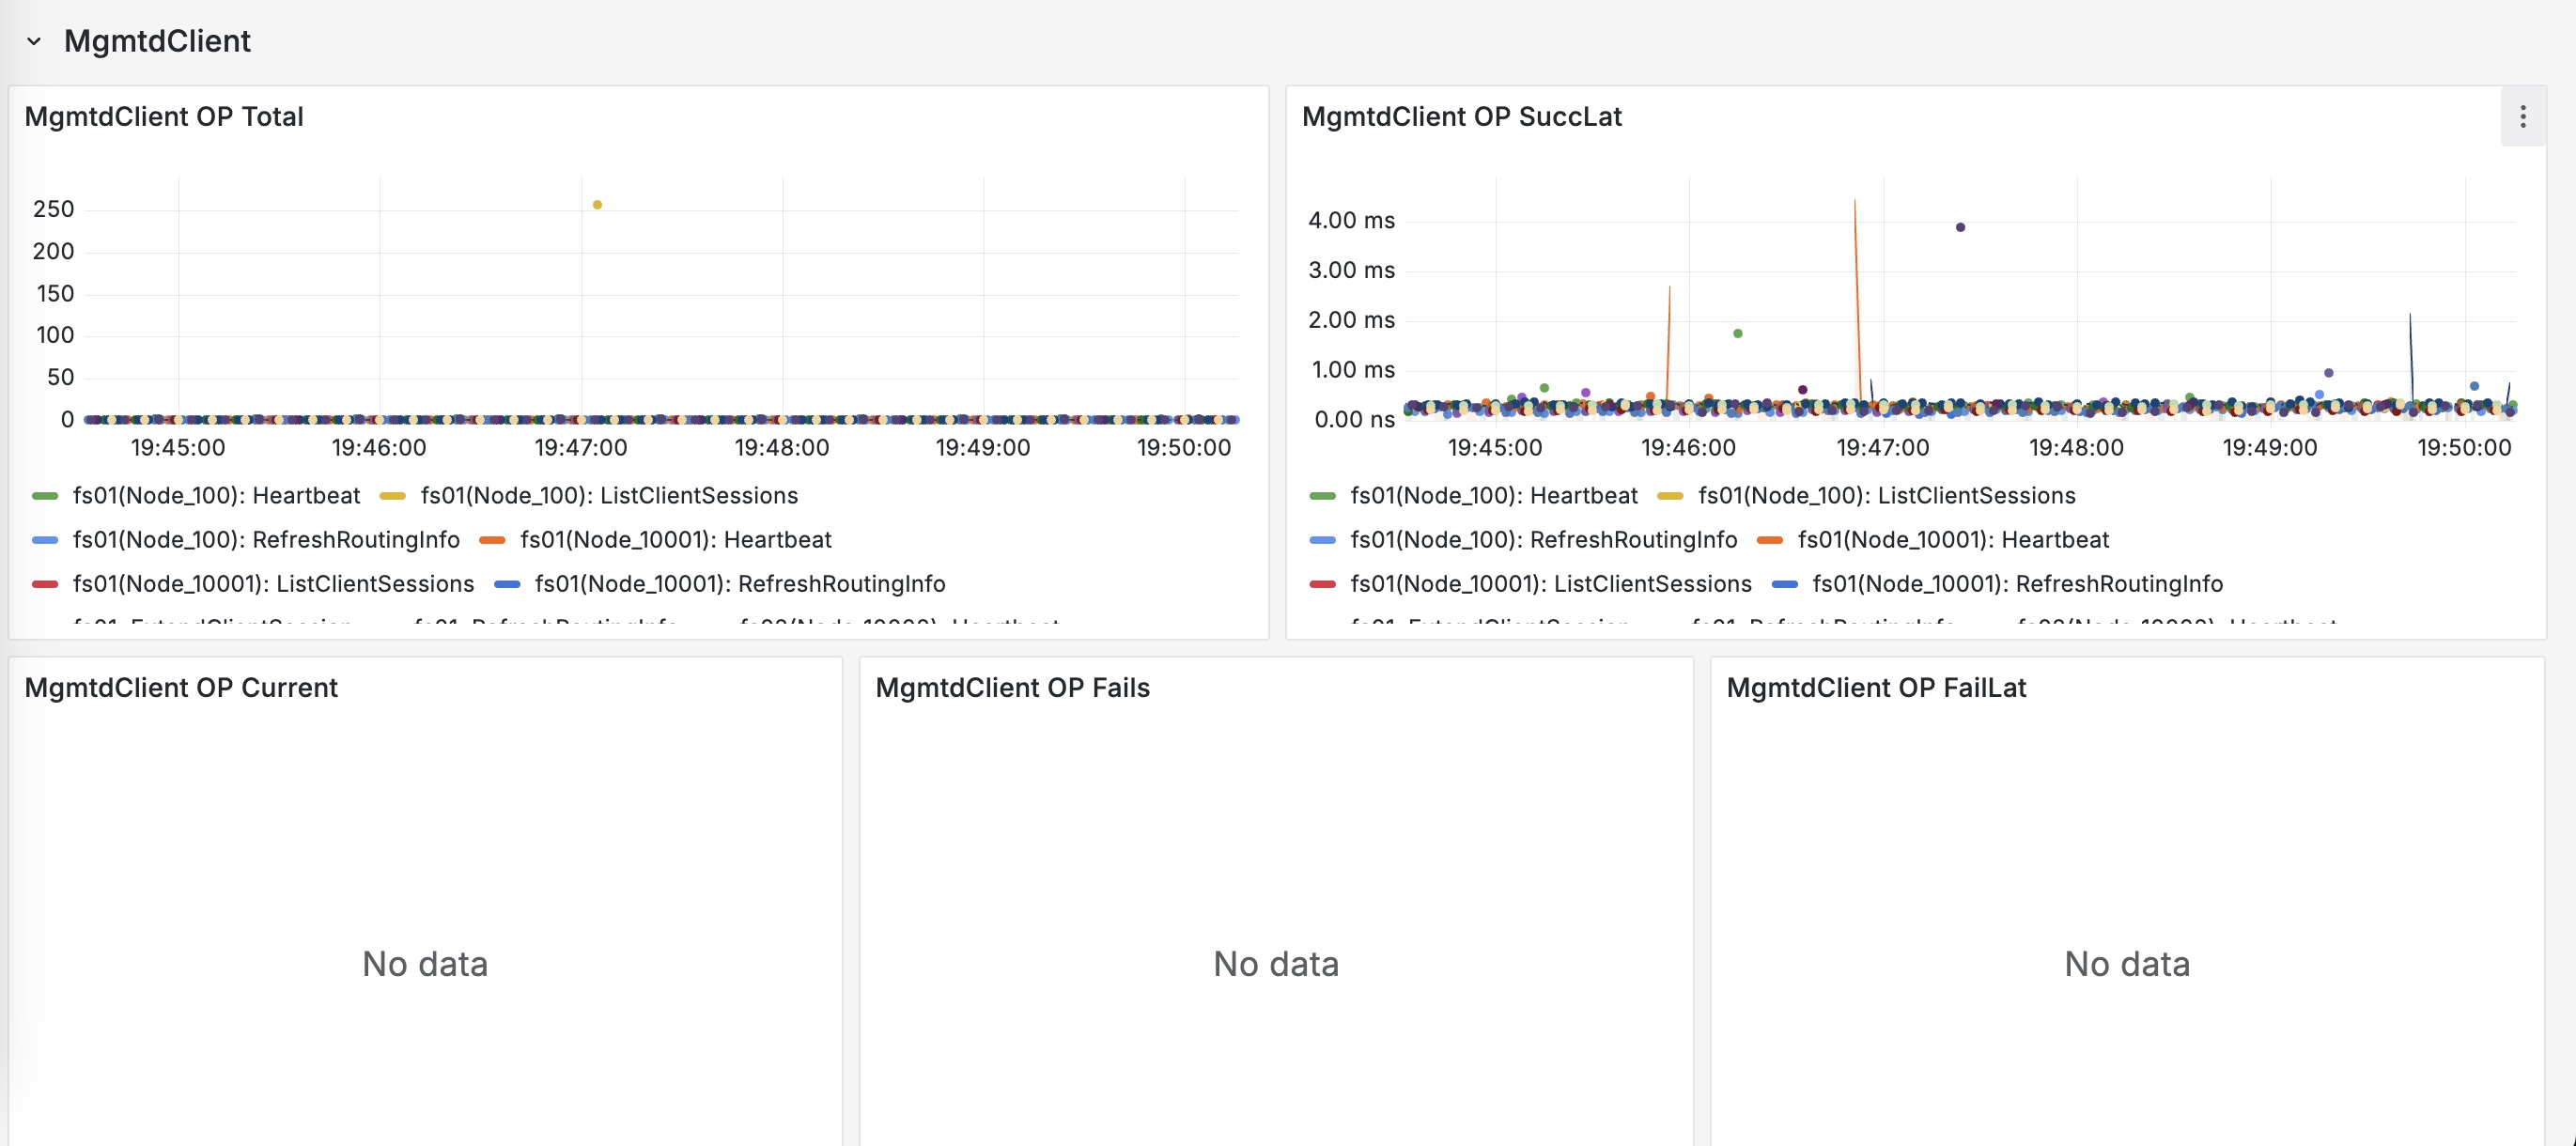
3FS Mgmtd
The Grafana monitoring dashboard for the mgmtd granularity of the 3FS (Fire-Flyer File System).
Instructions
- Install the
ClickHouseplugin in Grafana. - Create a new data source in Grafana named
3fs-clickhouse. - Use the monitoring dashboard.
Data source config
Collector type:
Collector plugins:
Collector config:
Revisions
Upload an updated version of an exported dashboard.json file from Grafana
| Revision | Description | Created | |
|---|---|---|---|
| Download |